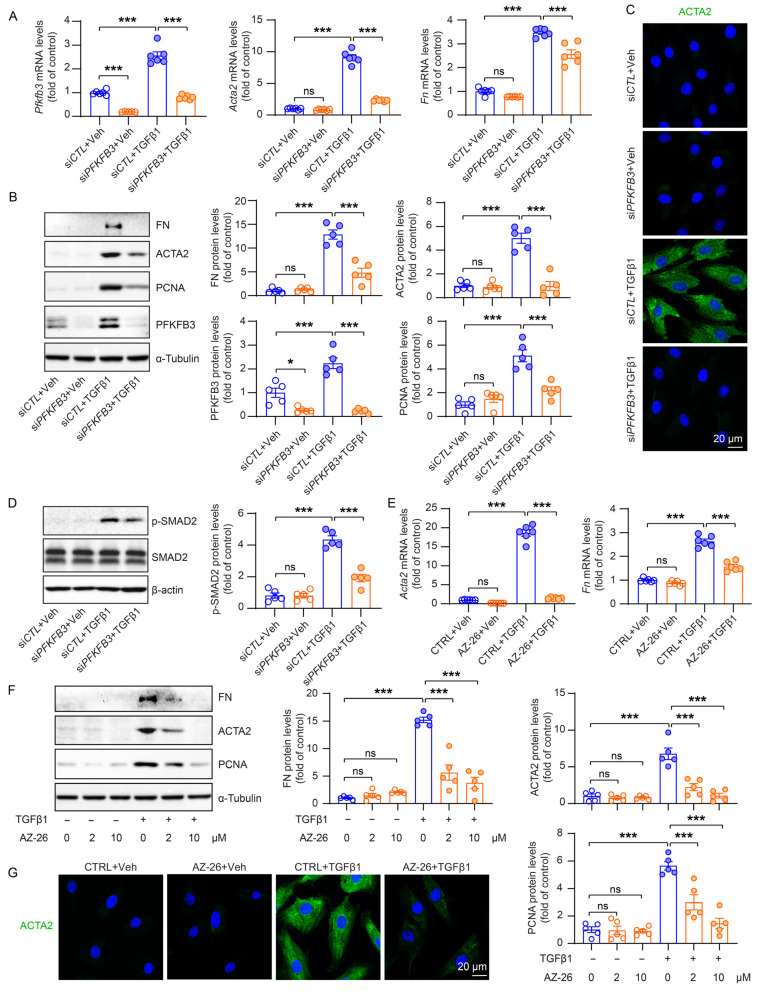
Figure 8.
The reduced fibrotic activity of Pfkfb3-knockdown renal myofibroblasts. (A) qRT-PCR analysis of the mRNA expression of Pfkfb3, Acta2, and Fn in NRK-49F cells transfected with siCTL or siPFKFB3 for 48 h and treated with a vehicle or TGFβ1 for 24 h; n = 6. (B) Representative Western blots and their quantification showing FN, ACTA2, PCNA, and PFKFB3 protein levels in NRK-49F cells transfected with siCTL or siPFKFB3 for 48 h and treated with a vehicle or TGFβ1 for 24 h; n = 5. (C) Representative image of ACTA2 staining of NRK-49F cells transfected with siCTL or siPFKFB3 for 48 h and treated with a vehicle or TGFβ1 for 24 h. Scale bar = 20 μm. (D) Representative Western blots and quantification of p-smad2, smad2/3, and ACTA2 in NRK-48F cells transfected with siCTL or siPFKFB3 for 48 h and treated with a vehicle or TGFβ1 for 24 h. (E) qRT-PCR analysis of the mRNA expression of Acta2 and Fn in NRK-49F cells treated with a vehicle or TGFβ1 for 24 h in the absence or presence of AZ-26 (n = 6). (F) Representative Western blots and their quantification showing FN, ACTA2, and PCNA protein levels in NRK-49F cells treated with a vehicle or TGFβ1 for 24 h in the absence or presence of AZ-26 (n = 5). (G) Representative image of ACTA2 staining of NRK-49F cells treated with a vehicle or TGFβ1 for 24 h in the absence or presence of AZ-26. Scale bar = 20 μm. Data are means ± SEM. ns, no significance; * p < 0.05; *** p < 0.001 for indicated comparisons. Statistical significance was determined using one-way ANOVA followed by the Bonferroni test (A,B,D–F).

