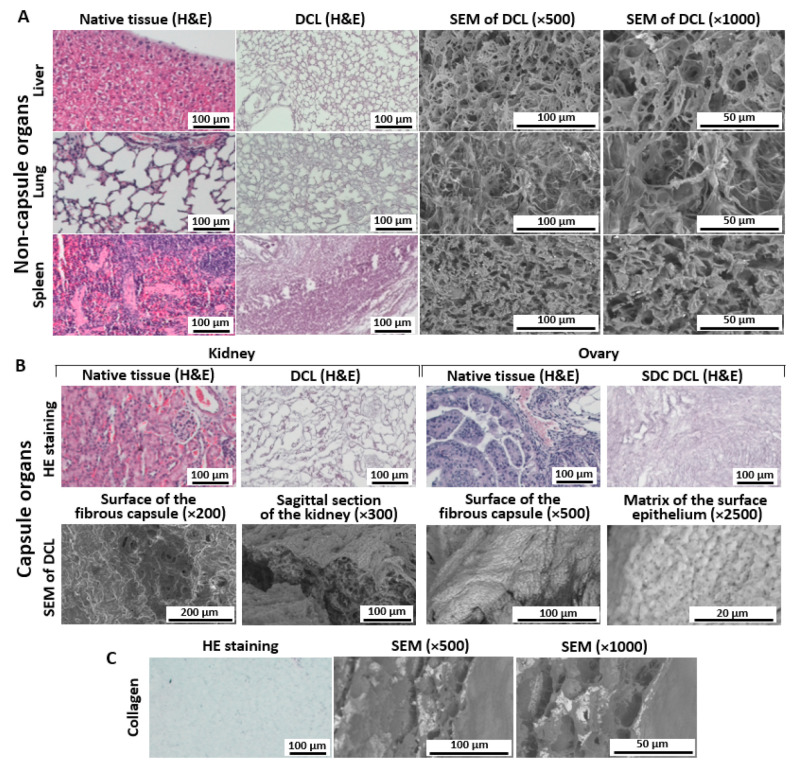
Figure 2.
Histomorphological and SEM analysis of decellularized matrices obtained from non-capsule organs (A), capsule organs (B), and a collagen matrix (C). Representative images from 20 to 50 samples are shown. For histological analysis, hematoxylin–eosin staining was used. Two different magnifications for SEM images are provided in (A,C) to visualize the degree of integrity of the matrix and the morphology of fibers. For capsule organs (B), SEM images were obtained for different parts of the organ to represent variability in structure. See explanations in the text.

