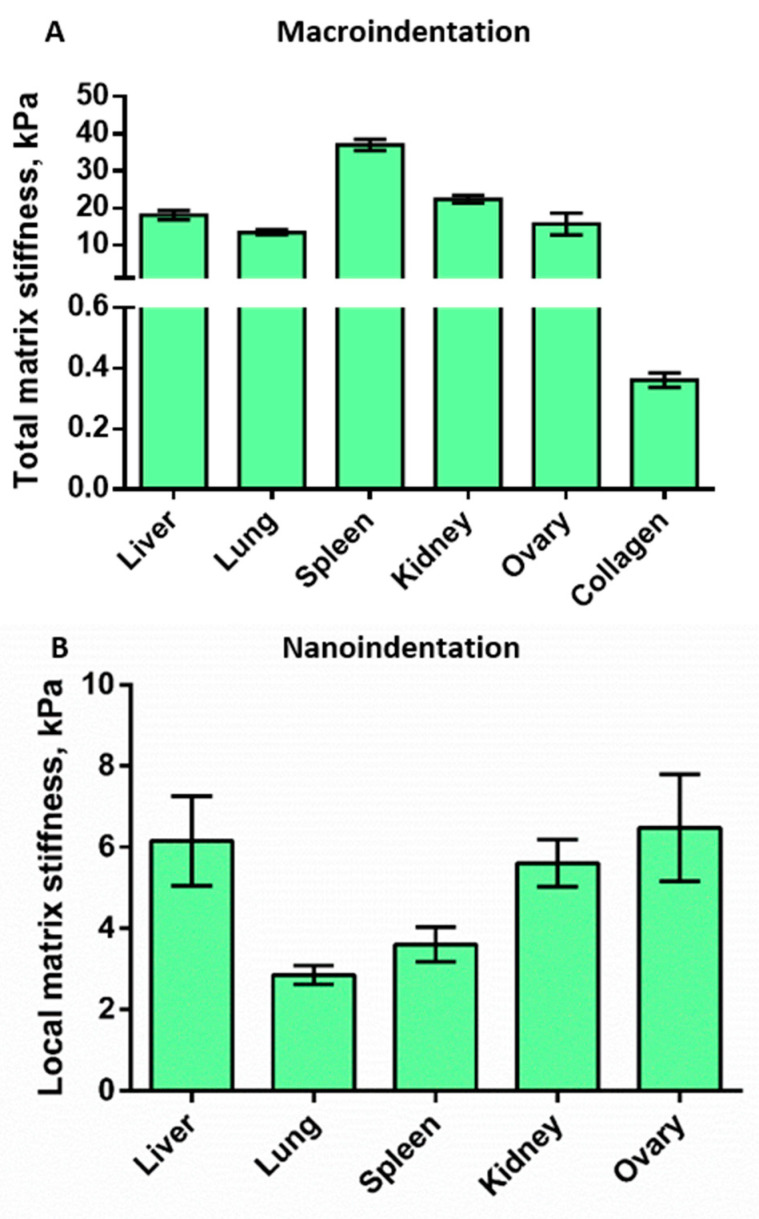
Figure 4.
Stiffness characteristics of matrices measured by macroindentation (A), and nanoindentation (B). (A) Total matrix stiffness, measured by macroindentation. A decrease in Young’s modulus in the series spleen > kidney > liver > ovary > lung ≫ collagen was observed (n = 20). For details of statistical comparison between matrices, see Figure S5. (B) Local matrix stiffness measured by nanoindentation. A relatively large difference between all the samples was demonstrated with the lung being the softest (n = 25–30). For details of statistical comparison between matrices, see Figure S6.

