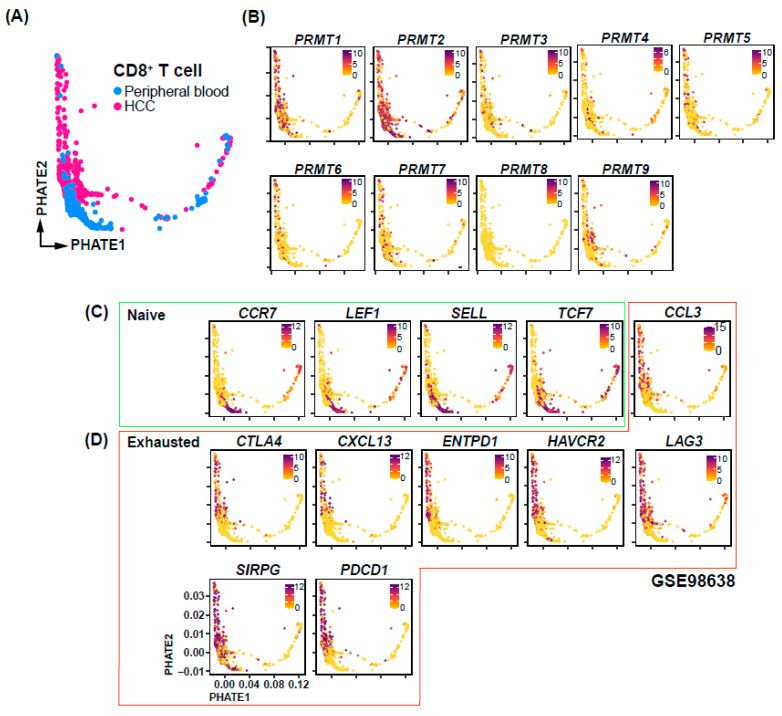
Figure 7.
PRMT expression and immune checkpoint correlations in CD8+ cells of HCC patients. (A) UMAP-based Trajectory Analysis elucidating the developmental trajectory of CD8+ T cells in peripheral blood and HCC samples. (B) UMAP visualization identifying the differential expression patterns of PRMT family genes across distinct cell types. (C,D) Cell type-specific UMAPs representing the transcriptional profiles of genes in naïve (C) and exhausted (D) condition.

