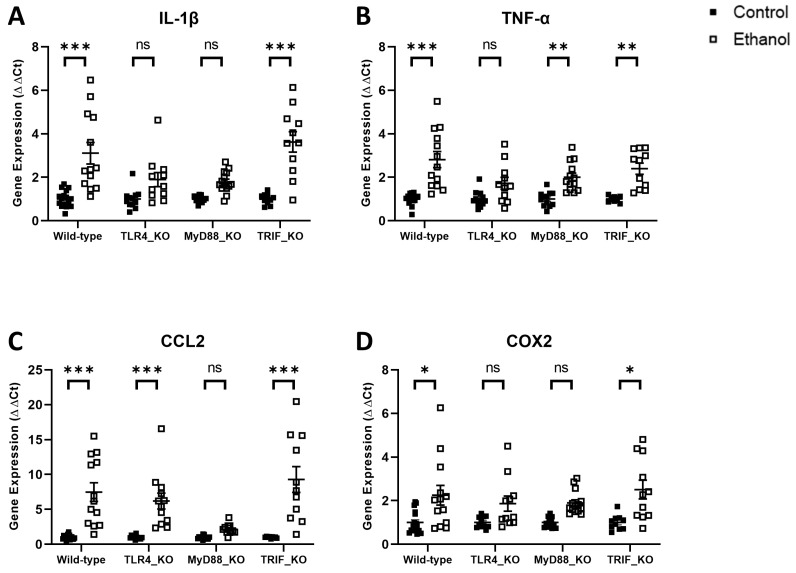
Figure 3.
Effects of ethanol on IL-1β (A), TNF-α (B), CCL2 (C), and COX2 (D) mRNA expression in the cerebellum of wild-type, TLR4-, MyD88-, and TRIF-deficient mice. Mice were given access to control or ethanol liquid diet, as described in Methods, and relative mRNA expression was measured using qRT-PCR. Results were expressed as ∆∆CT fold change relative to control for each genotype. Individual values for each sample were plotted and error bars denote mean +/− SEM. *** p < 0.001, ** p < 0.01, * p < 0.05, ns = not significant.

