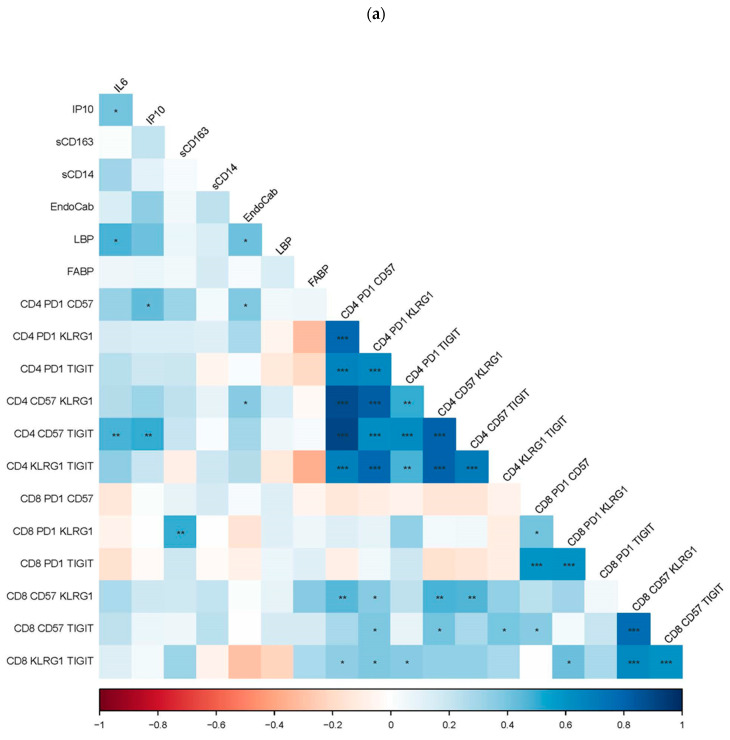
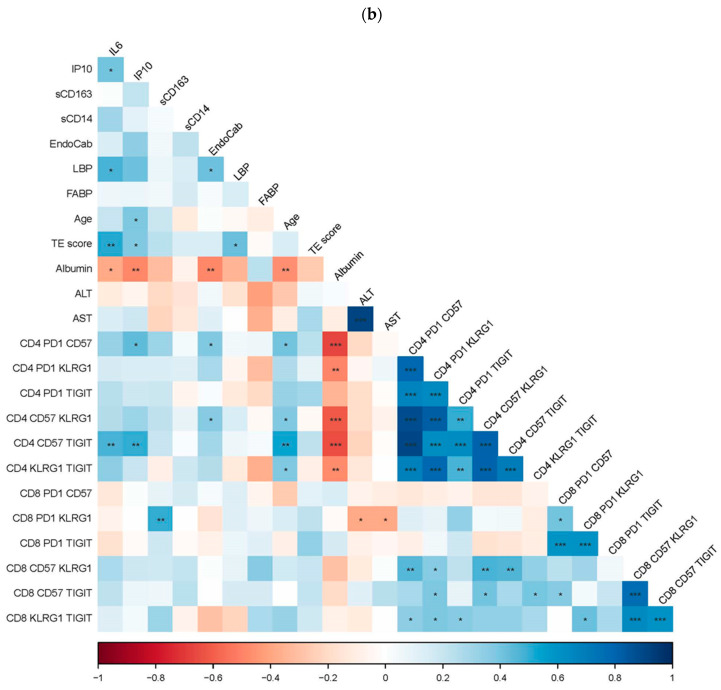
Figure 3.
(a) The association of T cell exhaustion and senescence with soluble indices of inflammation and endotoxemia. The proportions of T cells co-expressing markers of exhaustion and senescence from HCV-infected participants were examined for correlations with levels of soluble markers of inflammation (IL-6, IP10, sCD163, sCD14) and endotoxemia (EndoCab, LBP, FABP) using Spearman’s rank order statistical tests. The r value of correlation is represented by the color and color intensity. Positive correlations are blue, and negative are red. Statistically significant correlations are represented with an asterisk, * p = ≤0.05; ** p = <0.001; *** p = <0.0001. (b) Association of liver health with endotoxemia, inflammation, T cell exhaustion, and senescence during HCV infection. The proportions of T cells co-expressing markers of exhaustion and senescence and plasma levels of IL-6, IP10, sCD163, sCD14, EndoCab, LBP, and FABP were examined for correlations with indices of liver health, age, albumin, ALT, AST, and transient elastography (TE) score using Spearman’s rank order statistical tests. The r value of correlation is represented by the color and color intensity. Positive correlations are blue, negative are red. Statistically significant correlations are represented with an asterisk, * p = ≤0.05; ** p = <0.001; *** p = <0.0001.


