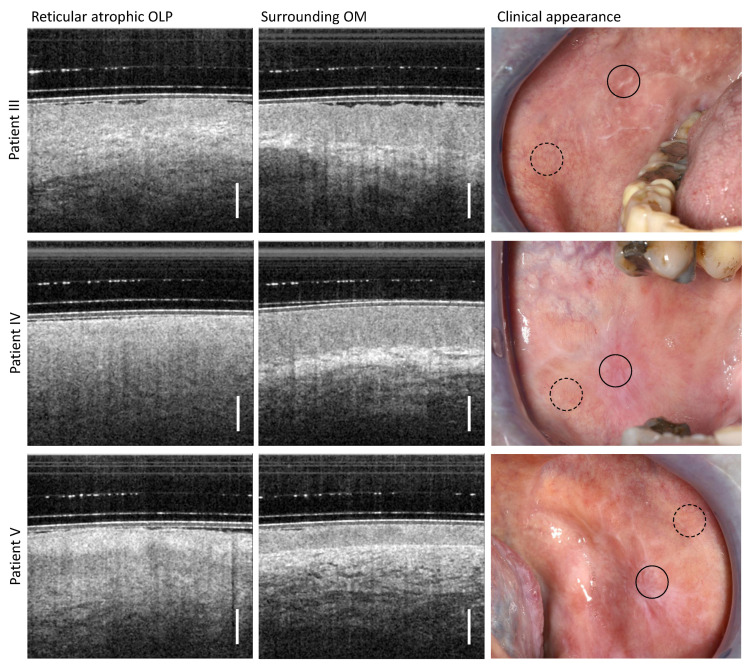
Figure 4.
Comparison of OCT cross-sectional images for the center of the reticular atrophic lesion of the oral mucosa (left column) and the surrounding region of the buccal mucosa (middle column) of patient III (upper row), patient IV (middle row) and patient V (lower row). Photographs for the documentation of the clinical appearance of reticular atrophic OLP with marked locations of OCT imaging: OLP center (circle with black solid line) and surrounding OM (circle with black dashed line). Scale bar 500 µm.

