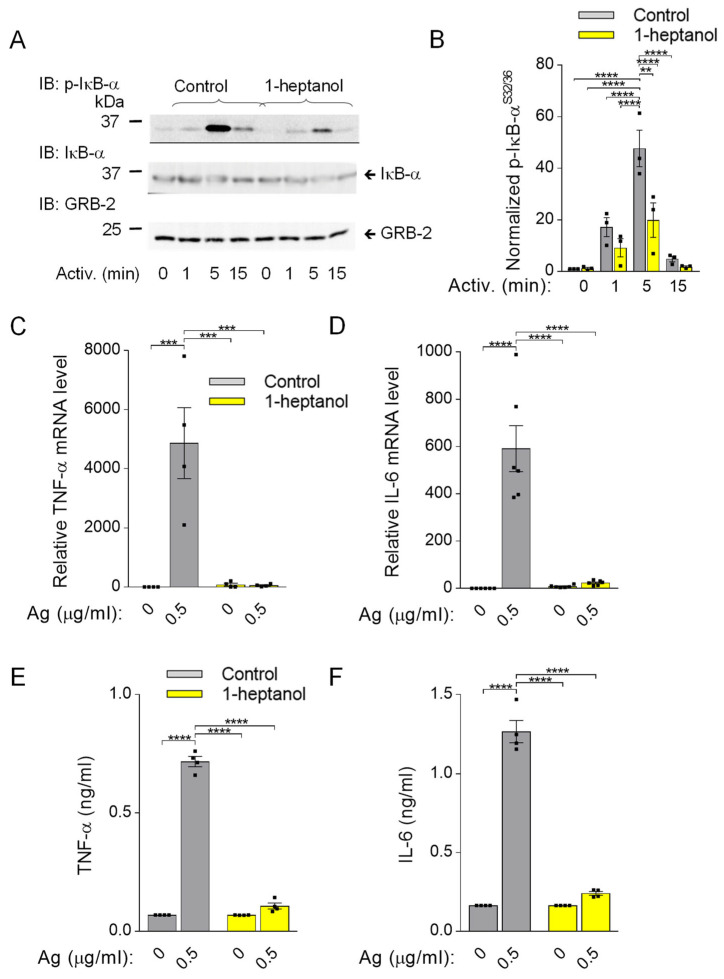
Figure 9.
Impaired IκB-α phosphorylation and cellular TNF-α expression in 1-heptanol-treated BMMCs. (A) IκB-α phosphorylation (p-IκB-α) and expression of IkB-α and GRB-2 were determined by SDS-PAGE size-fractionation and IB of lysates from BMMCs treated with 2.5 mM 1-heptanol or vehicle (Control) and activated for the indicated time intervals with antigen (TNP-BSA; 0.5 µg/mL; n = 3). Representative immunoblots developed with the corresponding antibodies are shown. (B) The results from the quantification of data as in A normalized to signals in non-activated cells and loading control proteins. (C,D) RT-PCR quantification of TNF-α mRNA ((C); n = 4) and IL-6 ((D); n = 6) in non-activated or antigen-activated (Ag; 0.5 µg/mL; 1h) BMMCs pretreated for 15 min with 2.5 mM 1-heptanol or vehicle (Control). (E,F) The levels of TNF-α (E) and IL-6 (F) released into the supernatant of IgE-sensitized BMMCs pretreated with vehicle (Control; n = 4) or 2.5 mM 1-heptanol (n = 4) and non-activated or activated with antigen (Ag) for 4 h. Values indicate means ± SEM calculated from n, which show the numbers of biological replicates; ** p < 0.01, *** p < 0.001, **** p < 0.0001.

