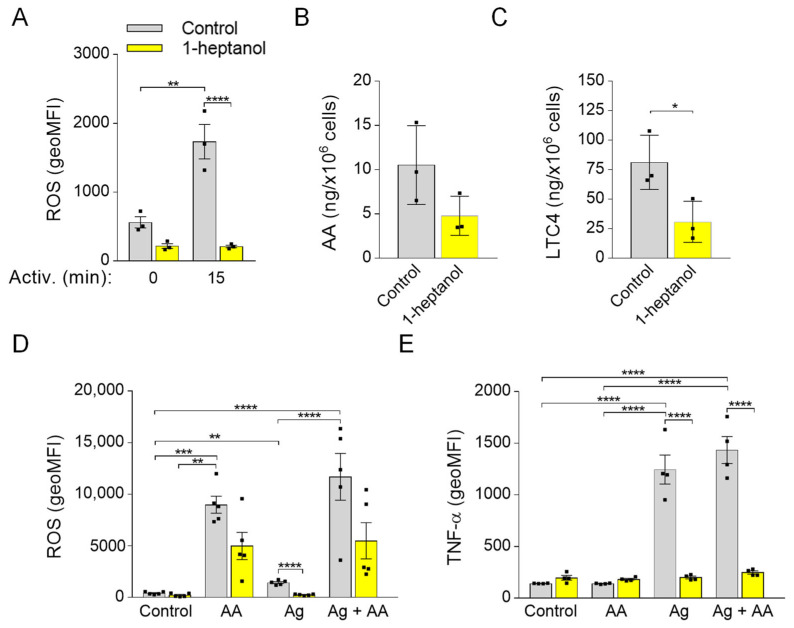
Figure 10.
Reduced production of ROS and LTC4 in 1-heptanol-treated cells and the effect of ROS restoration by arachidonic acid on TNF-α production in BMMCs. (A) IgE-sensitized and H2DCFDA-loaded BMMCs were incubated for 15 min in the presence of a vehicle (BSS-BSA; Control; n = 3) or 2.5 mM 1-heptanol (n = 3). BMMCs were then activated with antigen (Ag; 0.5 µg/mL). Fifteen min later, the fluorescence signal was quantified by flow cytometry. (B,C) UPLC MS/MS analysis of arachidonic acid (AA; B) and LTC4 (C) from supernatants of untreated (Control; n = 3) or 1-heptanol-treated (n = 3) antigen-activated BMMCs. (D) IgE-sensitized and H2DCFDA-loaded BMMCs were prepared as in A. BMMCs were then untreated (Control; n = 5) or treated with arachidonic acid (n = 5), antigen (0.5 µg/mL; n = 5), or antigen in combination with arachidonic acid (n = 5). The fluorescence signal was quantified as above. (E) Analysis of cellular TNF-α production by flow cytometry in non-activated IgE-sensitized BMMCs (Control; n = 4), cells exposed for 1.5 h to arachidonic acid (n = 4), antigen alone (n = 4) or antigen and arachidonic acid (n = 4), and concurrently in the presence or absence of 2.5 mM 1-heptanol. Values indicate means ± SEM calculated from n, which show the numbers of biological replicates; * p < 0.05, ** p < 0.01, *** p < 0.001, **** p < 0.0001.

