Figure 3.
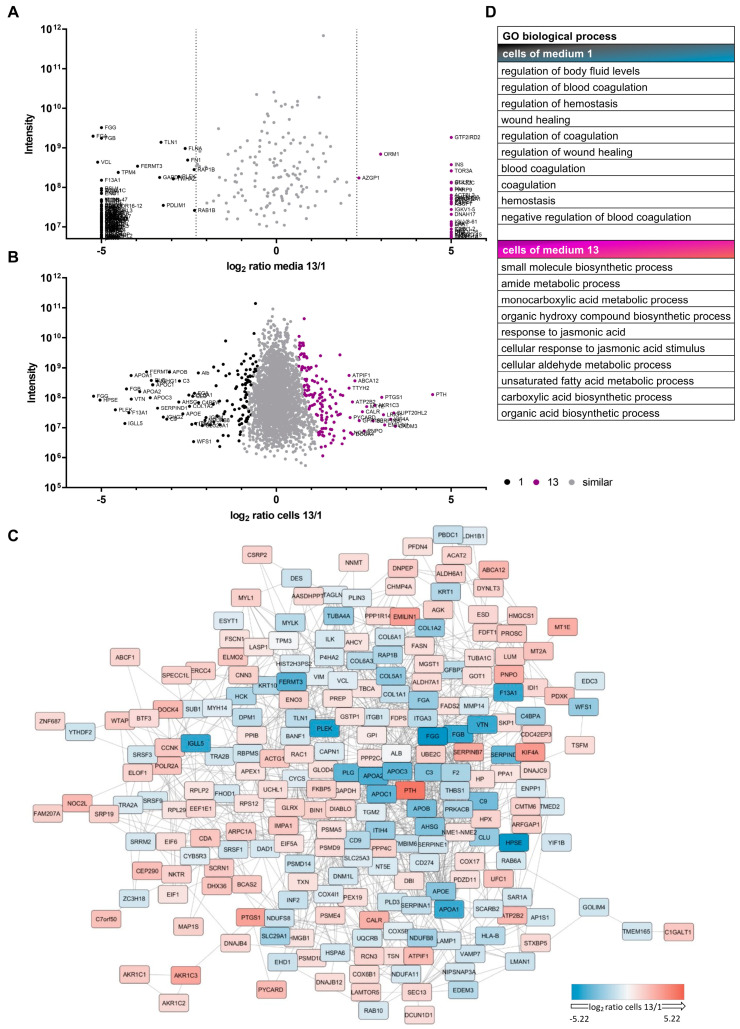
Proteomic analyses of media and MSCs. MSCs, isolated and expanded in αMEM+8%PL (medium 1; black) or StemMACSTM (medium 13; violet), and respective media were used for proteomic analyses. Log2 ratio of proteins identified in media 1 and 13 (A) or expressed by cells grown in media 1 and 13 (B) are illustrated. Proteins with similar quantity or expression are shown as gray dots, proteins with high quantity in medium 1 (A) or highly expressed in cells grown in medium 1 (B) are shown as black dots and those with high quantity in medium 13 (A) or high expression in cells grown in medium 13 (B) are shown as violet dots, respectively. (C) Differentially expressed proteins shown in (B) were queried for known interactions on StringDb [60] and visualized. (D) Expressed proteins seem to play a role in various biological processes based on gene ontology (GO) enrichment analysis.

