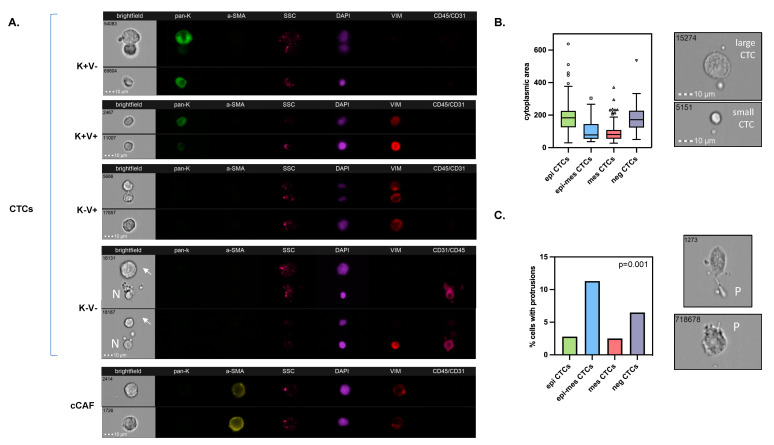
Figure 1.
Characterization of CTCs in breast cancer: Examples of their different phenotypes (A), comparison of their sizes defined as cytoplasmic area (B), and occurrence of protrusions among them (C). BF indicates brightfield, pan-K—pan-keratins, a-SMA—alpha-smooth muscle actin, SSC—side scatter, Vim—vimentin, CD45/CD31—leukocyte/endothelial cell marker, N—normal cell, arrows—CTC, P—protrusions; all images were captured with objective 40×.

