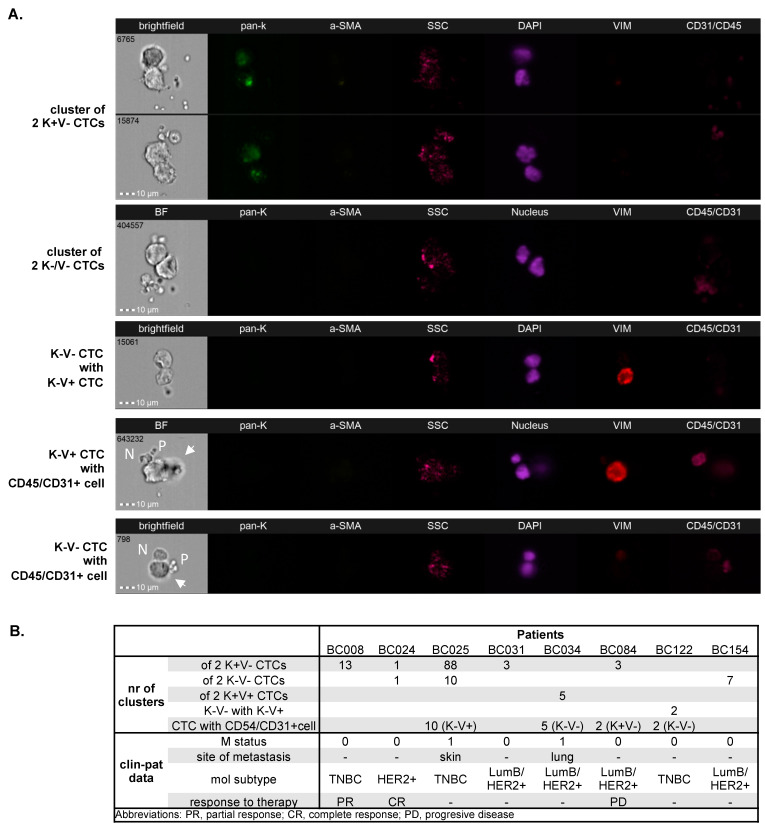
Figure 2.
CTCs and CTC–normal cell clusters in breast cancer detected using imaging flow cytometry: Homogeneous, heterogeneous clusters, and CTC clusters with normal cells (A). Clinico-pathological data of cluster-positive patients (B). BF indicates brightfield, pan-K—pan-keratins, a-SMA—alpha-smooth muscle actin, SSC—side scatter, Vim—vimentin, CD45/CD31—leukocyte/endothelial cell marker, N—normal cell, P—platelets, arrows—CTC; all images were captured with objective 40×.

