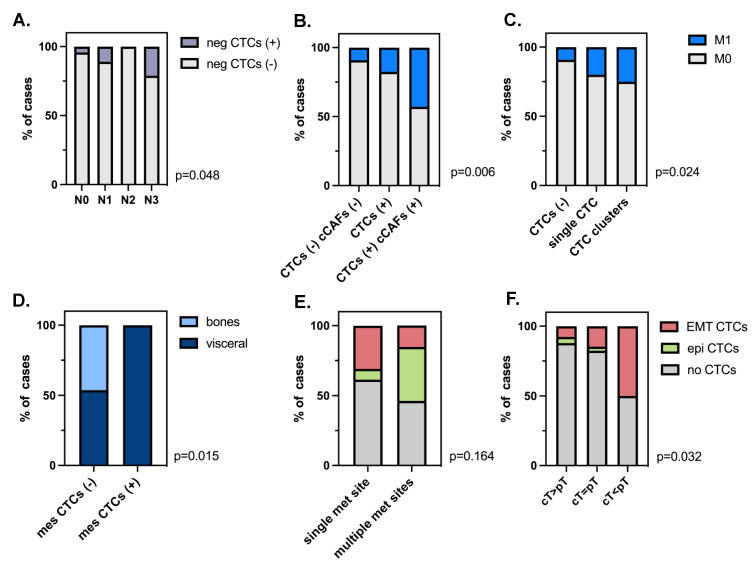
Figure 4.
Clinical relevance of different phenotypes of CTCs and cCAFs: Distribution of negative (neg) CTCs by N status (A), presence of metastases depending on CTCs/cCAFs (B), and single/clustered CTC status (C); mesenchymal (mes) CTC correlation with a site of metastases (D), CTC phenotype correlation with number of metastases (E) and with response to therapy (F).

