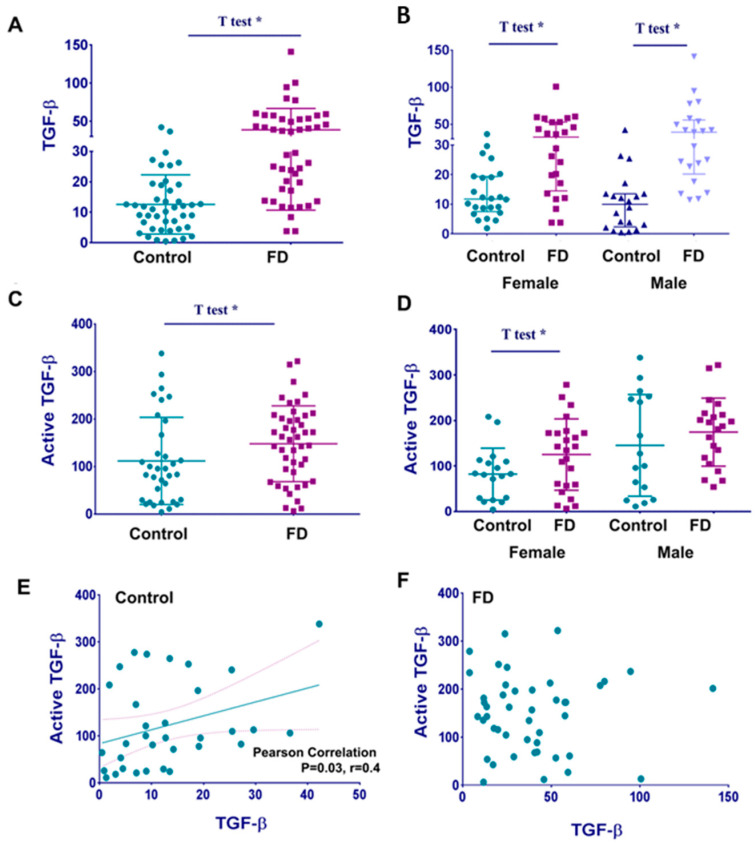
Figure 1.
Circulating levels of TGF-β1 and “active form of TGF-β1”. (A) TGF-β1 levels in plasma from healthy controls and patients with FD are compared. Statistical analysis using an unpaired t-test and F-test to compare cohorts demonstrated a significant difference between control and FD cohorts. TGF-β1 (ng/mL) represented as a mean ± SDEV, p < 0.05 t-test. (B) The stratification of TGF-β1 based on gender and cohort groups showed that female and male patients with FD had a significantly higher level of TGF-β1 compared to female and male healthy controls. p < 0.05, t-test and F-test. (C) The active form of TGF-β1 levels in healthy control vs. patients with FD. Statistical analysis using an unpaired t-test and F-test to compare cohorts demonstrated no difference between the control and FD. (D) An active form of TGF β1 level in control females and female patients with FD, control males, and male patients with FD. (E) Scatterplot analysis of correlation of TGF-β1 and active TGF-β1 in plasma of healthy controls. * p < 0.03, Pearson correlation tests, two tails. (F) Scatterplot analysis of correlation of TGF-β1 and “active-TGF-β1” in plasma from patients with FD. No significant correlation between the two biomarkers.

