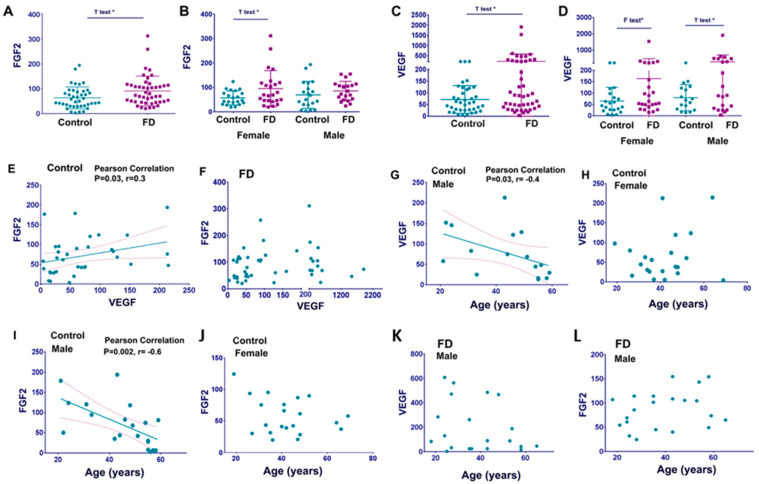
Figure 2.
Circulated levels of FGF2 and VEGF-A. (A) FGF2 levels control vs. FD. Statistical analysis using an unpaired t-test demonstrated a significant difference between control and FD cohorts. p < 0.05 t-test. FGF2 pg/mL represented as a mean ± SDEV. (B) FGF2 levels in control females and female patients with FD, control males, and male patients with FD. p < 0.05 F-test, comparison control females vs. FD females. (C) VEGF-A levels control vs. FD. Statistical analysis using an unpaired t-test and F-test to compare cohorts demonstrated a significant difference between the healthy control and FD. VEGF-A pg/mL represented as a mean ± SDEV. (D) VEGF-A level in control vs. FD in gender-divided groups. p < 0.05 t-test, comparison control males vs. FD males, p < 0.05 F-test, comparison control females vs. FD females. (E,F) Scatterplot analysis of the correlation of FGF2 and VEGF in healthy controls (E) and FD (F). (G,H) Scatterplot analysis of correlation of age (years) and VEGF in healthy controls: males (G) and females (H). (I,J) Scatterplot analysis of correlation of age (years) and FGF2 in healthy controls: males (I) and females (J). (K,L) Scatterplot analysis of age vs. VEGF (K) and age vs. FGF2 (L) in male patients with FD showed an absent correlation between age and circulated VEGF and FGF2, respectively. * p < 0.05.

