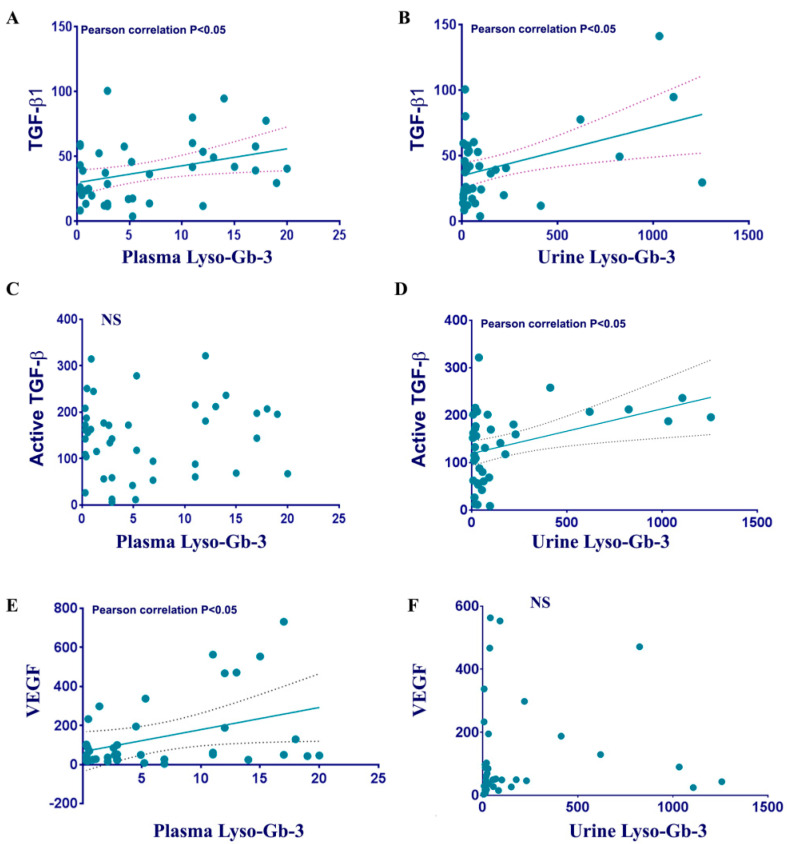
Figure 4.
Correlation analysis between growth factor and accumulation of Lyso-Gb-3 in FD. (A,B) Scatterplot analysis of correlation of TGF-β1. Pearson correlation, two tail p < 0.05. (C,D) Scatterplot analysis of correlation of active TGFβ. Pearson correlation, two tail p < 0.05. (E,F) Correlation analysis between VEGF-A with plasma Lyso-Gb-3 (left panel) or urine Lyso-Gb-3 (right panel). Pearson correlation, one tail p < 0.05.

