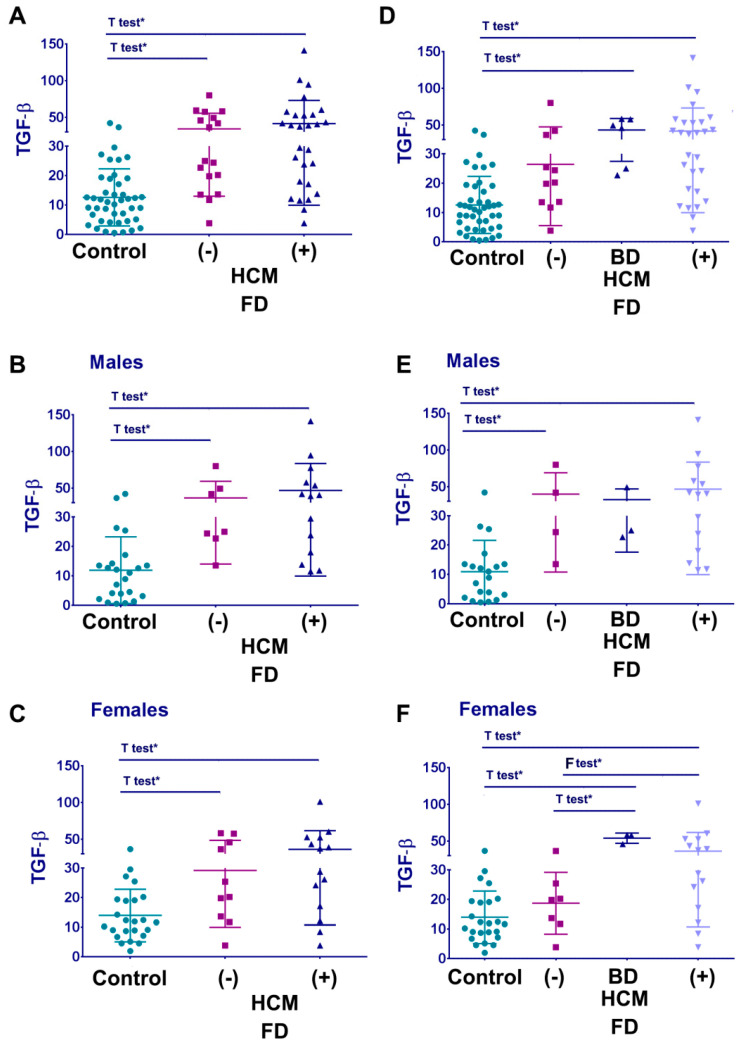
Figure 5.
Plasma TGF-β1 and HCM in FD. (A–C) Level of TGF-β1 in the healthy control cohort (control), FD cohort without HCM, and with HCM. Graphs represent all FD patients (A), only males (B), and females (C). (D–F) Comparing levels of TGF-β1 in the healthy control, FD cohort without HCM and normal EKG, without HCM but abnormal EKG, and FD patients with HCM. Graphs represent all FD patients (D), males (E), and females (F). Data represented in pg/mL, mean ± SDEV, Kruskal–Wallis test. p < 0.0001 (significant difference for all graphs), * t-test or F-test: p < 0.05.

