Figure 7.
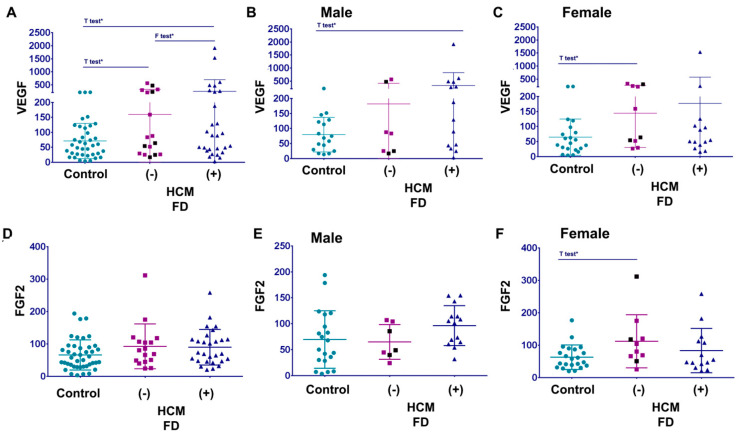
Angiogenic biomarkers VEGF-A and FGF2 in FD patients with cardiomyopathy: (A) VEGF-A level in the healthy control cohort (control), FD cohort without HCM, and FD patients with HCM. Purple square is the group: no HCM and normal EKG. The black square is the group: no HCM and abnormal EKG. (B,C) The same cohorts for VEGF-A analysis are for male (B) and female (C) groups. Data represented as mean + STDEV. One tail t-test p < 0.05. F test p < 0.05. (D) FGF2 level in the healthy control, FD cohort without HCM (HCM−) and with HCM (HCM+). Purple square is the group: no HCM and normal EKG. The black square is the group: no HCM and abnormal EKG. (E,F) FGF2 analyses are for male (E) and female (F) FD patients. Data are represented as mean + STDEV. One tail t-test * p < 0.05.

