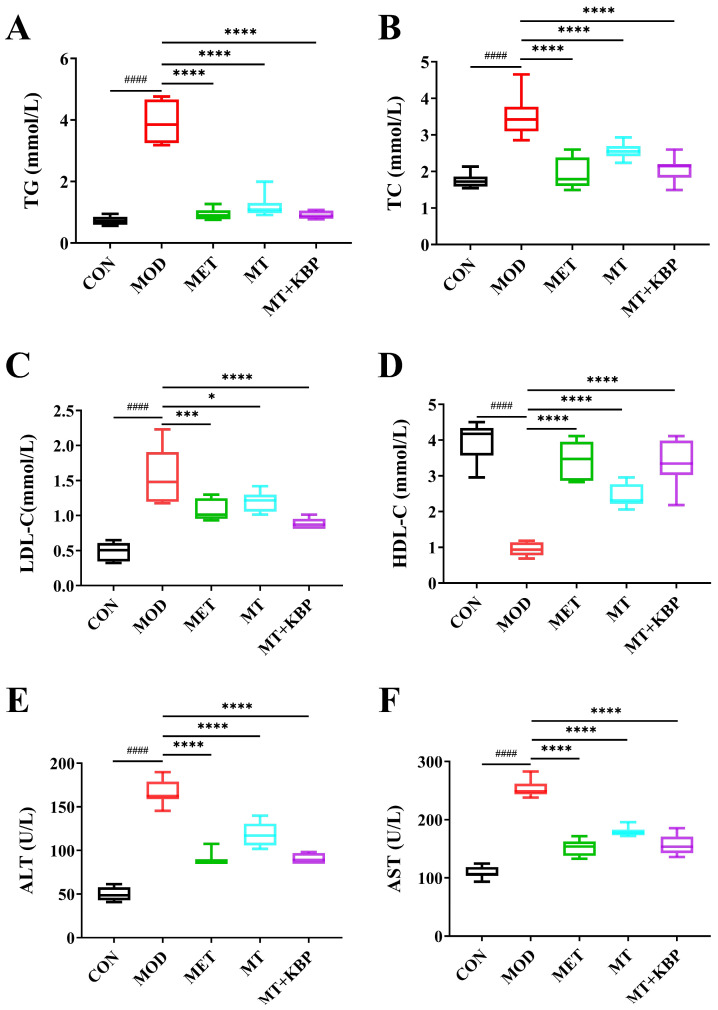
Figure 4.
Effect of the MT–kidney bean polyphenol complex on biochemical indicators in rats with T2DM. (A) TC; (B) TG; (C) LDL-C; (D) HDL-C; (E) ALT; (F) AST. Data are expressed by mean ± standard deviation, n = 8. (#### p < 0.0001 versus CON; * p < 0.05, *** p < 0.001, and **** p < 0.0001 versus MOD).

