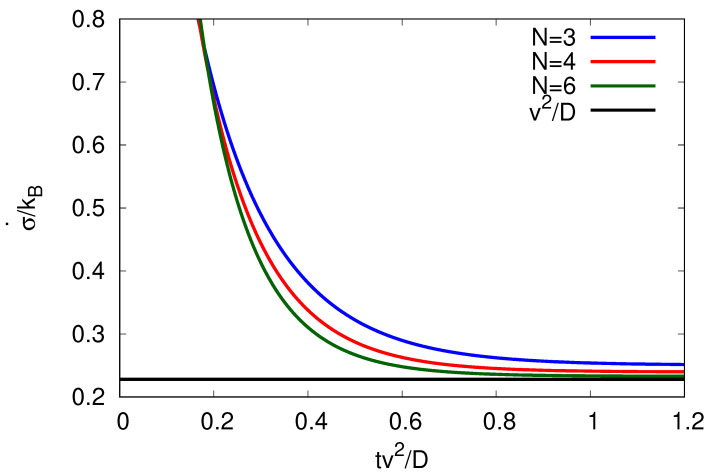
Figure 1.
Entropy production rate against time plotted for different N-site cycles by keeping the velocity v and diffusion coefficient D constant. The velocity v (here chosen to be ) needs to be within the bounds implied by of Equation (13) for . The steady-state value (black curve) is reached for .

