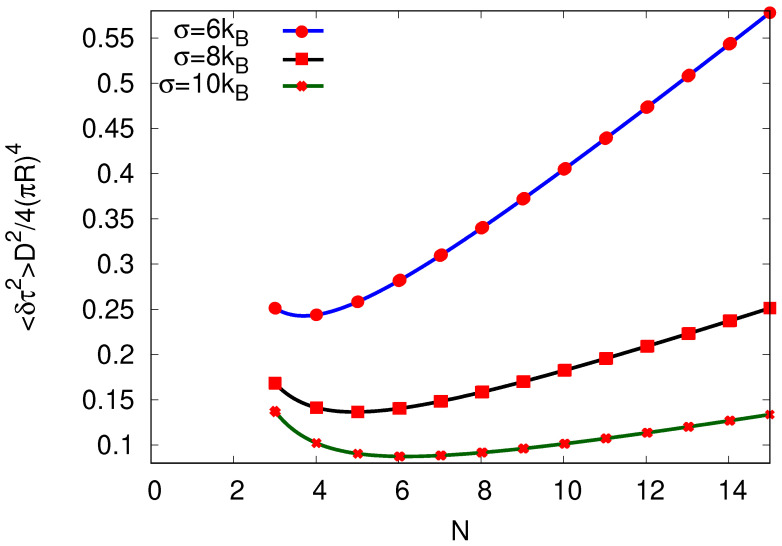
Figure 6.
Variance in cycle completion time plotted against the number N of sites per cycle by keeping the entropy per cycle and the diffusion coefficient D constant for , while the velocity results from Equation (24). We show for three different choices of .

