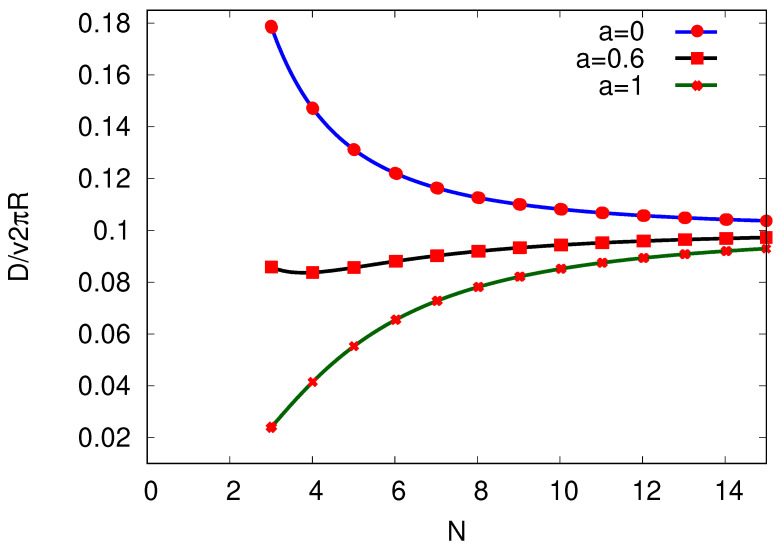
Figure 8.
The diffusion coefficient D plotted against the number of sites N per cycle by keeping the entropy production per cycle and velocity v constant. The chosen time interval for given N is restricted by the inequality (46). We take (where ) and depict with (blue curve), (black curve), and (green curve). We chose the produced entropy per cycle to be for .

