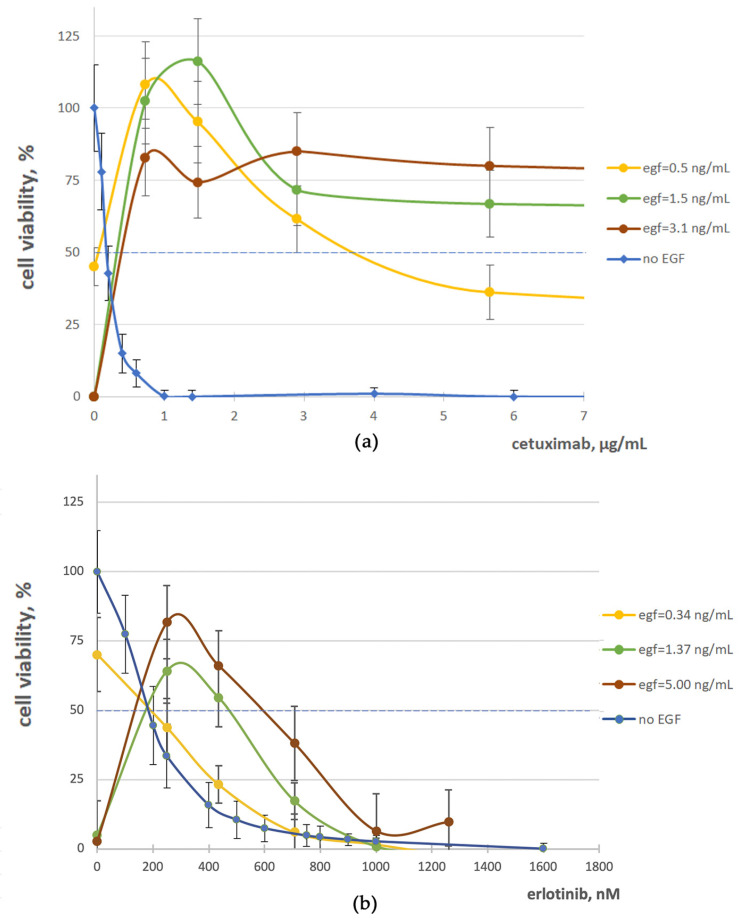
Figure 4.
A431 cell growth rate with cetuximab (a) or erlotinib (b) without EGF (blue curve) and in the presence of EGF (yellow, green, and red curves), in different concentrations. Dose–response curves were calculated using at least three biological replicates of every experiment normalized to no-drug conditions with FBS-only growth media (FBS).

