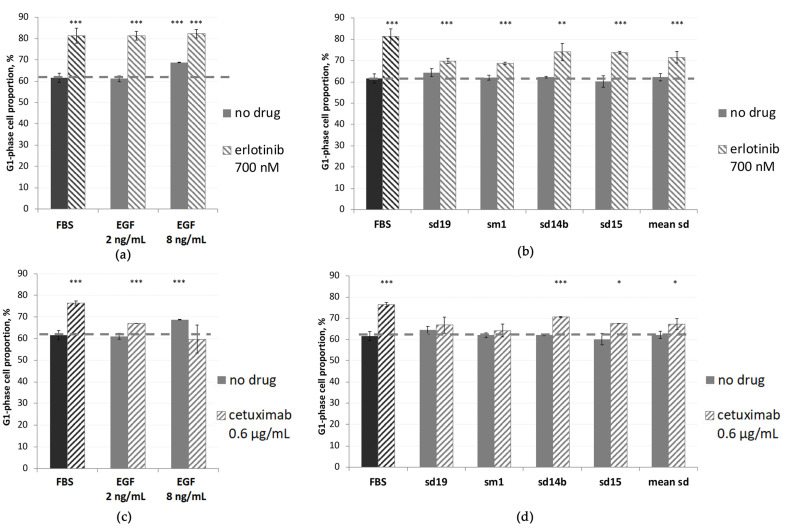
Figure 5.
The proportions of A431 cells in G1 phase of cell cycle after treatment with erlotinib (a,b) and cetuximab (c,d) in the presence of EGF or 5% human serum samples compared with non-treated cells (“FBS” black bars); Asterisks stand for statistically significant differences between FBS and other samples: *, p < 0.05; **, p < 0.01; ***, p < 0.001. The cell cycle distribution analysis was carried out by FACS analysis after cell staining with propidium iodide. Each bar represents the mean ± S.D. of three independent experiments.

