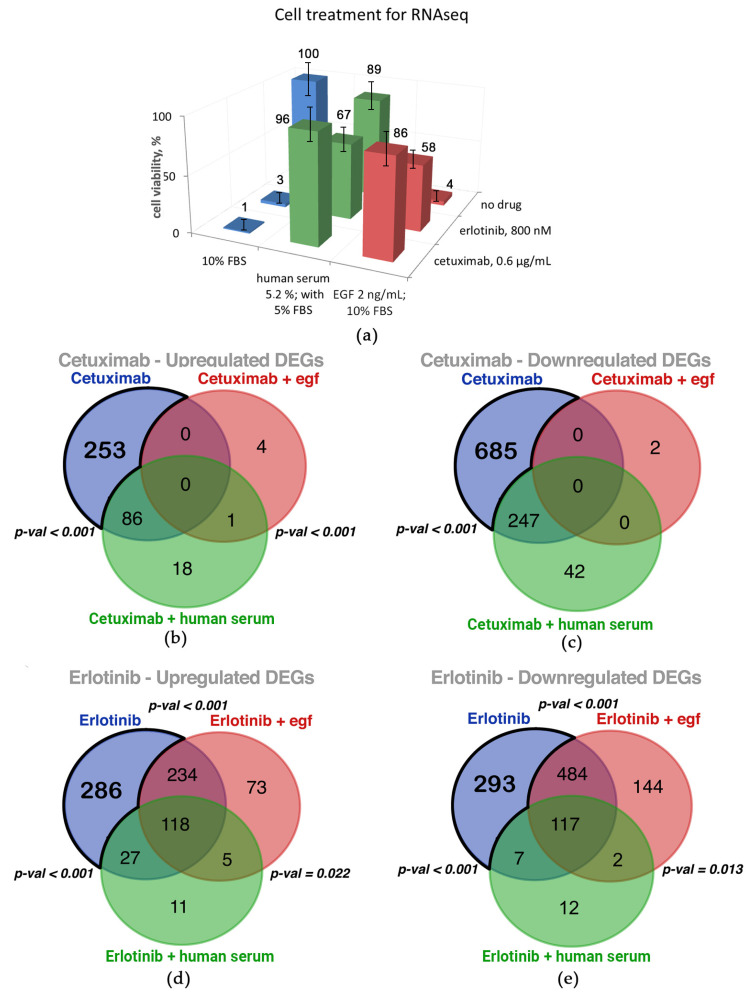
Figure 8.
(a) Cell growth under the cell treatment conditions used to collect samples for RNA sequencing. (b–e) Venn diagram showing the overlap in differentially expressed genes (DEGs) in the presence of cetuximab only and cetuximab along with human serum or along with EGF, (b,c); and in the presence of erlotinib, (d,e). Cetuximab core and Erlotinib core gene groups are outlined.

