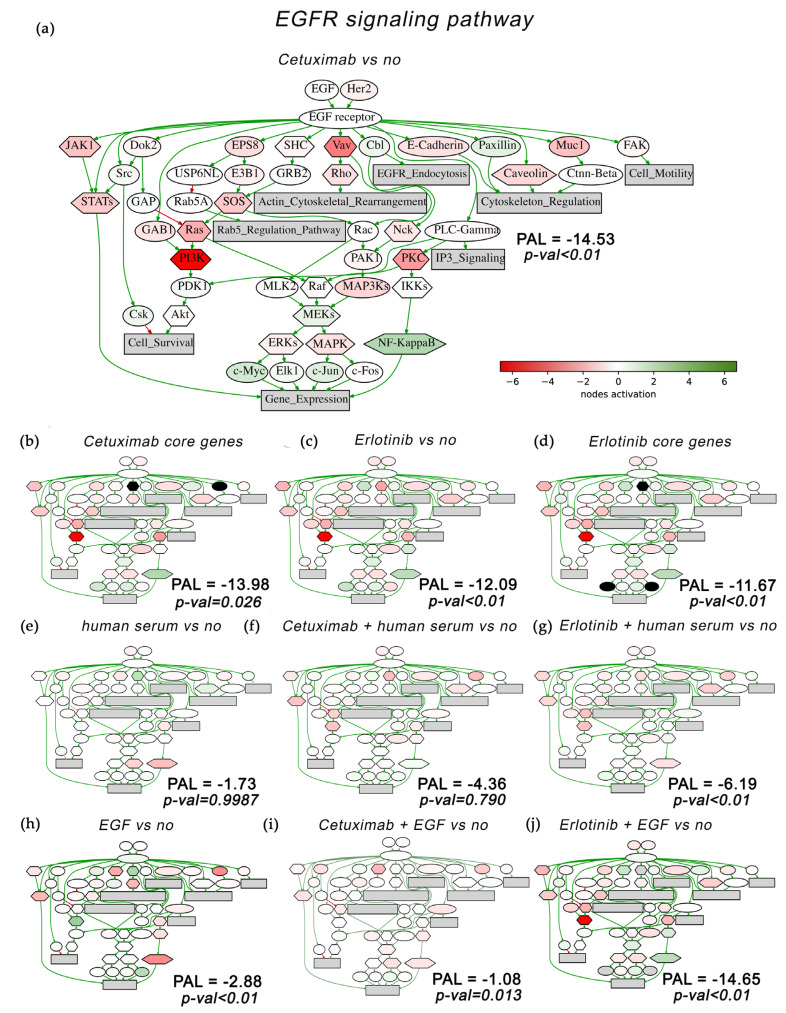
Figure 11.
Activation chart of EGFR pathway (Qiagen Pathway Central) shown as an interacting network. EGFR pathway components activation compared with no-drug conditions is shown for: (a) Cetuximab-only treatment; (b) Cetuximab core gene group; (c) Erlotinib-only treatment; (d) Erlotinib core gene group. EGFR pathway activation in the presence of human blood serum only treatment (e), in combination with cetuximab (f), and in combination with erlotinib (g) are shown. EGFR pathway activation in the presence of EGF only treatment (h), in combination with cetuximab (i), and in combination with erlotinib (j) are shown. EGFR pathway activation level (PAL) is indicated for each gene group. Green/red arrows indicate activation/inhibition interactions, respectively. The color depth of transcript nodes reflects the extent of node activation (natural logarithms of the expression fold change for each node; the reference is the geometric average between expression levels in all samples in the respective groups). Green stands for activation, red stands for inhibition, white stands for non-differential expression. On (b,d), black ovals show nodes for which the activation caused by cetuximab-only treatment differs from the cetuximab core gene group or the activation caused by erlotinib-only treatment differs from the erlotinib core gene group. Visualized using Oncobox software.

