Figure 3.
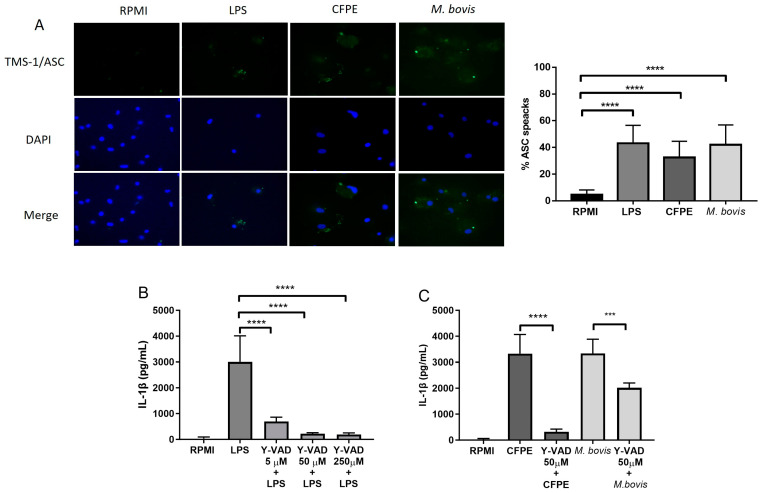
IL-1β release depends on ASC and caspase-1 in macrophages. (A) ASC specks in macrophages stimulated with LPS (300 ng/mL), culture filtrate extract (CFPE) at 100 µg/mL/1 × 106 cells, or M. bovis MOI 10:1 for 24 h. Fluorescence microscopy with a 40× objective was used, and ASC specks were quantified in macrophages stimulated with LPS, CFPE 100 µg/mL in 1 × 10⁶ cells, or M. bovis MOI 10:1 for 24 h. ASC specks are shown in green, and the cell nucleus is shown in blue. (B) IL-1β production in bovine macrophages treated with 250, 50, and 5 µM of Y-VAD 2 h before LPS stimulation. (C) IL-1β production in bovine macrophages treated with Y-VAD (50 µM) for 2 h before stimulation with CFPE (100 µg/mL in 1 × 10⁶ cells) or M. bovis MOI 10:1, respectively. ASC speck percentage was calculated by counting more than 100 fields for each condition using fluorescence microscopy images with 40× magnification. Results are shown as the mean ± S.D. of three independent experiments, each with three internal replicas. One-way ANOVA showed significant differences between cells treated with LPS, M. bovis, or CFPE versus cells treated with Y-VAD more LPS, M. bovis, or CFPE, respectively. *** p value ≤ 0.001 and **** p value ≤ 0.0001.

