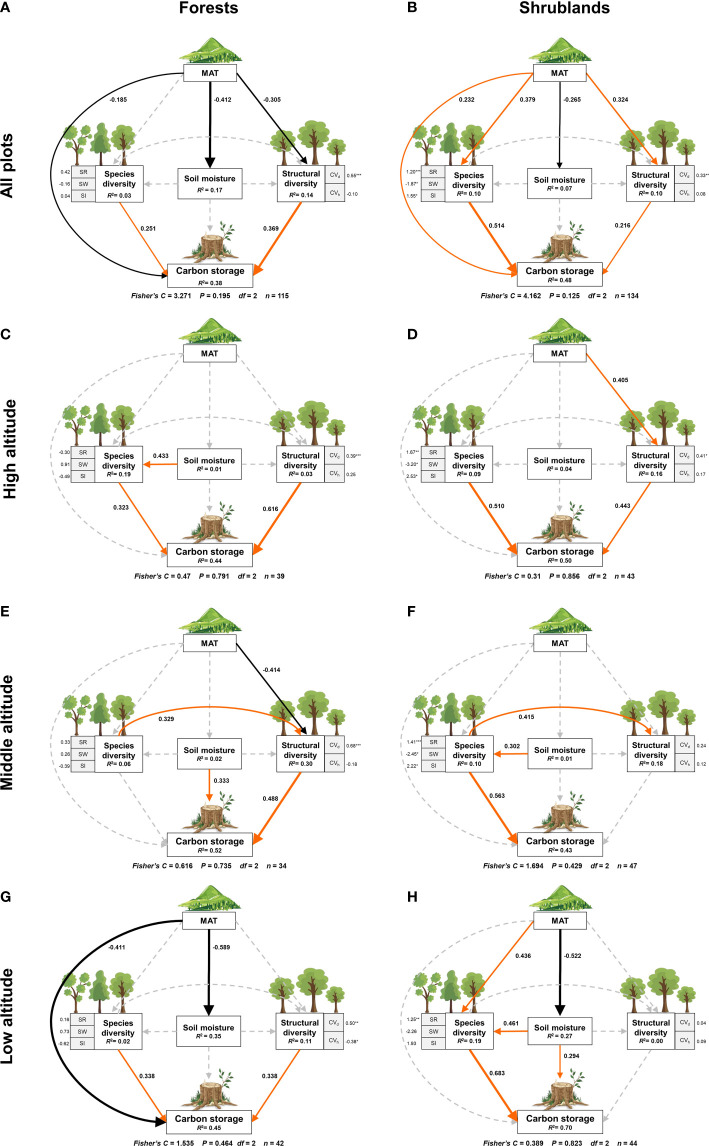
Figure 4.
The composite pSEM linking species diversity, structural diversity, mean annual temperature and soil moisture to carbon storage in temperate forests and shrublands. Solid red and black arrows represent significant positive and negative paths (P< 0.05) respectively, while dashed gray arrows show non-significant paths (P > 0.05). The numbers on the path are the standard path coefficients. Numbers adjacent to measured variables are their coefficients with composite variables. R2 represents the proportion of variance of each response variable explained by the predictors. MAT, mean annual temperature; CV d , coefficient of variation in diameter at breast height; CV c , coefficient of variation in tree height; SR, species richness index; SW, Shannon-Wiener index; SI, Simpson index.

