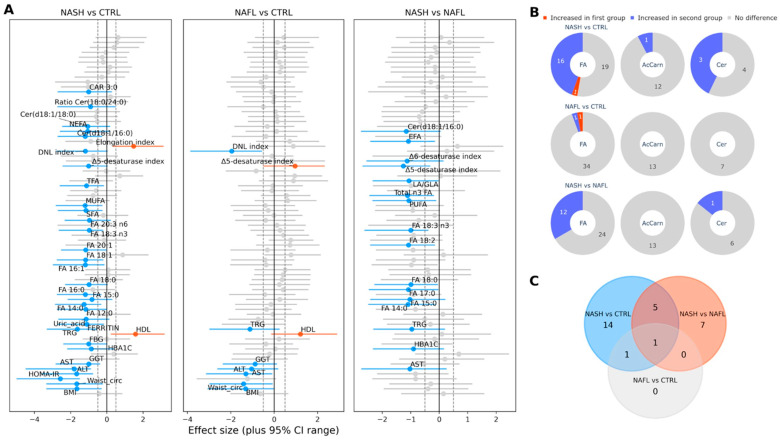
Figure 1.
Effect size analysis of the differences among the study groups. (A) Effect size plots of all the parameters studied: The calculated effect size of each variable is depicted along with the corresponding 95% CI. Variables that had an effect size value beyond the +/− 0.5 limit (gray dashed vertical lines) and simultaneously present a statistically significant difference with a Mann–Whitney U test p value < 0.05 are colored red and blue, respectively. (B) Pie chart with a comparison of the number of plasma lipid species (total fatty acids (FA), acylcarnitines (AcCarn), and ceramides (Cer)) that showed significant changes among the 3 groups: For each pair of groups compared, we have a record of the category of the plasma lipids compared. The criteria for a significant change and the color code are the same as those in Figure 1A. (C) Venn diagram showing the number of common significantly differentiated lipid species in the paired comparisons of the three groups of subjects: The common lipids for the NASH vs. NAFLD and NASH vs. control pairs are FA 14:0, 15:0, 18:0, 18:3n3, Δ5-desaturase index, and Cer(d18:1/16:0) μmol/L.

