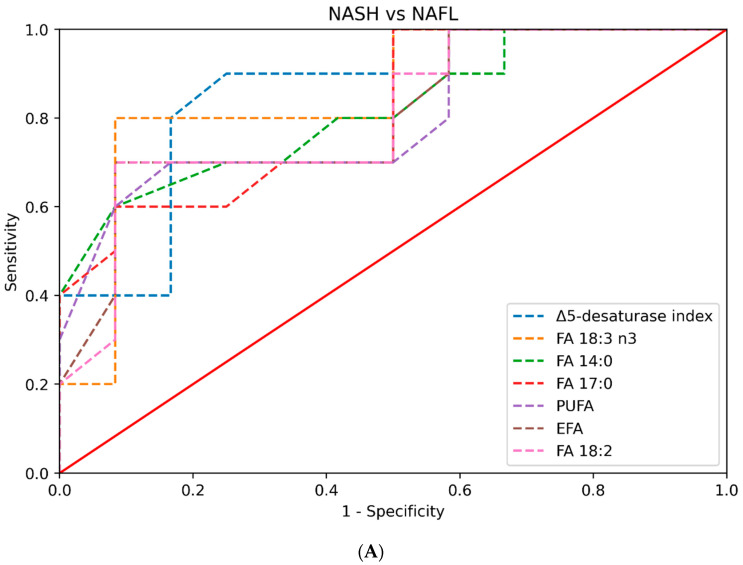
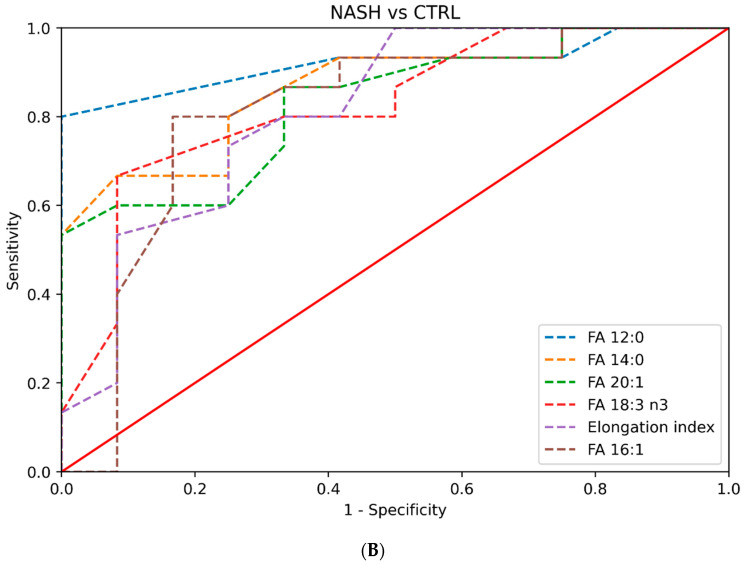
Figure 2.
(A) Plot of the AUC values of the plasma lipid species in the prediction of NASH in comparison to NAFL (only AUC values greater than 0.8 are depicted). (B) Plot of the AUC values of the plasma lipid species in the prediction of NASH in comparison to healthy controls (only AUC values greater than 0.8 are depicted).


