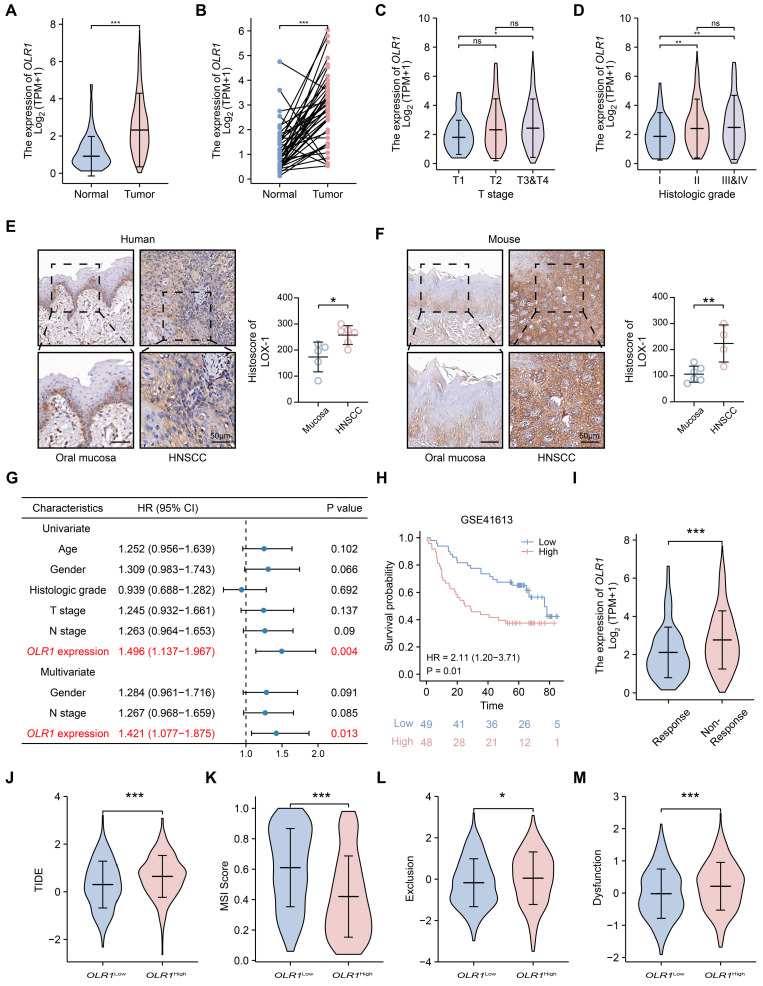
Figure 6.
Increased OLR1 expression is associated with poor prognosis and ICI resistance in HNSCC: (A) Violin plot showing that OLR1 expression is higher in tumors (n = 502) than in normal controls (n = 44) from the TCGA HNSCC cohort (*** p < 0.001); (B) OLR1 was upregulated in tumors (n = 43) compared to paired adjacent controls (n = 43) (*** p < 0.001); (C) violin plot showing OLR1 expression in different tumor T stages and (D) grades of HNSCC ( * p < 0.05, ** p < 0.01, and ns, not significant); (E) representative IHC images and quantification of LOX-1 in human mucosa (n = 5) and HNSCC (n = 6) (* p < 0.05 and bar, 50 μm); (F) representative IHC images and quantification of LOX-1 in mouse mucosa (n = 6) and HNSCC (n = 4) (** p < 0.01 and bar, 50 μm); (G) OLR1 expression was an independent poor prognostic factor for HNSCC patients according to the Cox regression analysis; (H) Kaplan–Meier analysis showed that HNSCC patients with high OLR1 expression levels had worse OS rates in the GSE41613 dataset (median cut-off, n = 97) (I) violin plot showing that OLR1 expression is higher in ICI-resistant HNSCC patients (n = 349) than in ICI-responsive HNSCC patients (n = 153) (*** p < 0.001); (J) TIDE; (K) MSI, (L) T-cell exclusion, and (M) dysfunction scores compared between the different OLR1 subgroups using the Wilcoxon test (* p < 0.05, *** p < 0.001). Data are mean ± s.d.

