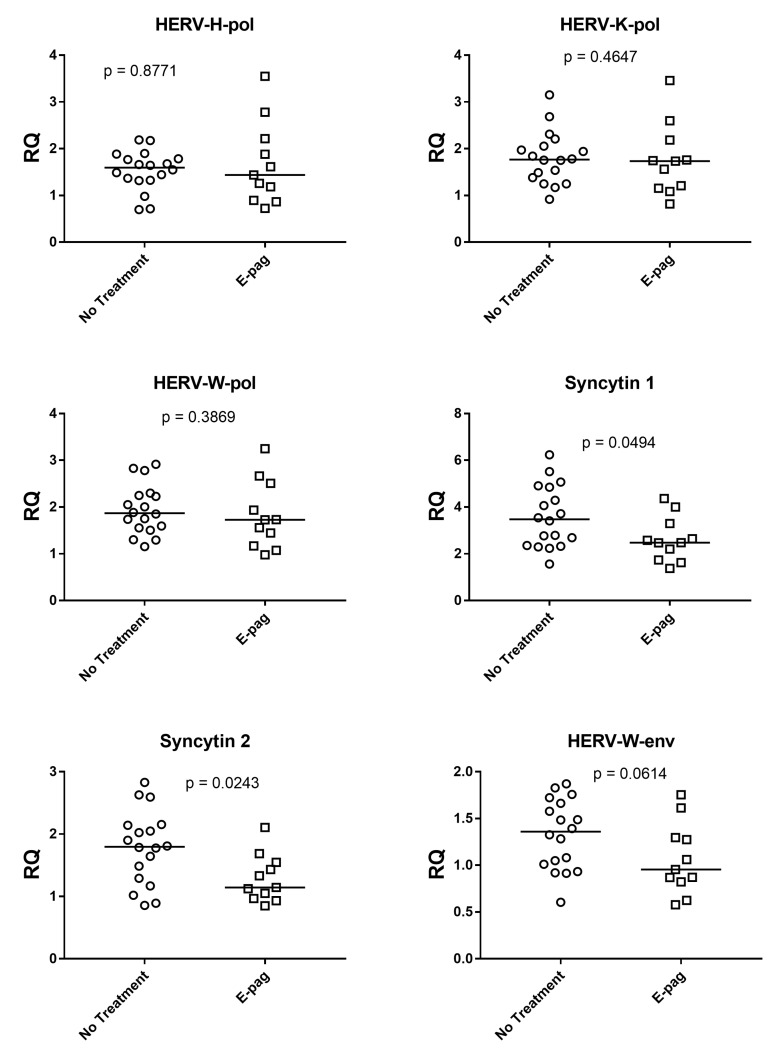
Figure 2.
Transcription levels of pol genes of HERV-H, HERV-K, and HERV-W as well as of env genes of Syncytin 1, Syncytin 2, and HERV-W in whole blood from 11 patients on eltrombopag treatment alone (E-pag) and 18 patients with no treatment. RQ: Relative Quantification. Circles and squares show the median of three individual measurements, horizontal lines are the median values. Statistical analysis: Mann–Whitney test was used to compare the transcriptional levels of each target gene.

