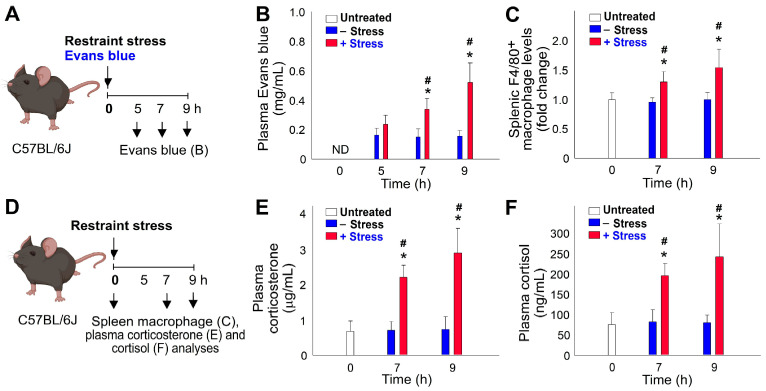
Figure 4.
Time-dependent increase in GI leakage, splenic macrophage infiltration, and stress hormone levels in response to the stress in experimental mice. (A,D) Experimental outlines. (B) Plasma levels of Evans blue. (C) Levels of F4/80+ macrophages in the spleen. (E) Plasma corticosterone levels. (F) Plasma cortisol levels. * p < 0.05, compared to respective 0 h untreated groups; # p < 0.05, compared to respective no stress (−stress) groups. The study involved six mice per group, with three experiments conducted in total (n = 6).

