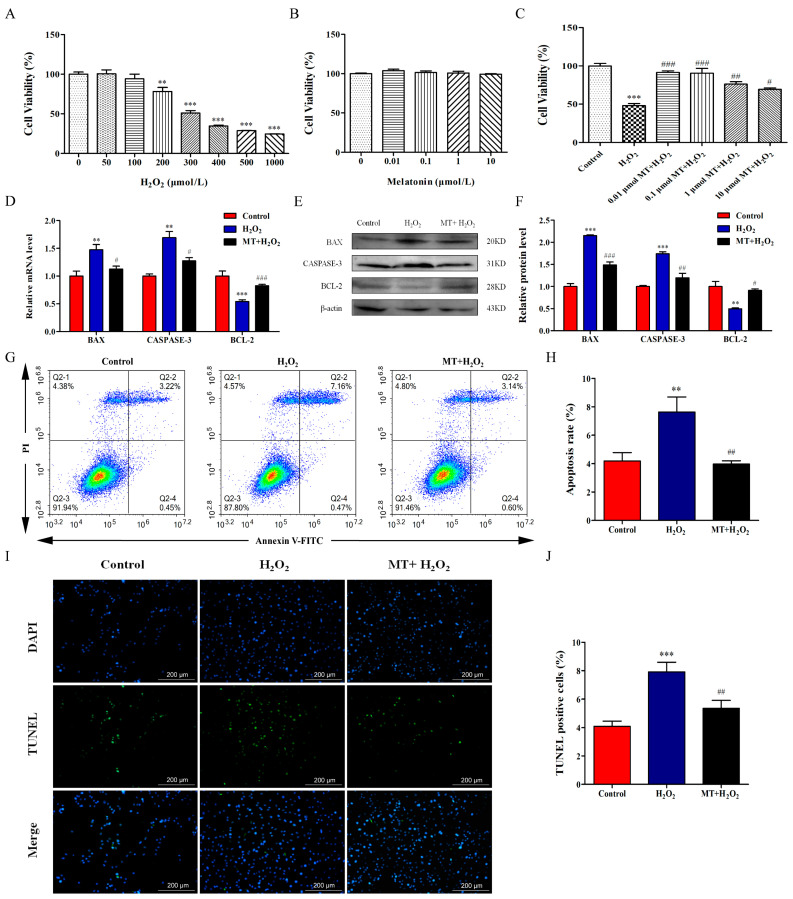
Figure 1.
Melatonin represses H2O2-induced apoptosis of bovine ovarian granulosa cells. (A) Cell viability was determined using a CCK-8 kit after cells were treated with H2O2 (0, 50, 100, 200, 300, 400, 500, 1000 μM) (n = 6). (B) Cell viability was determined after cells were treated with melatonin (0, 0.01, 0.1, 1, 10 μM) (n = 6). (C) After granulosa cells were cultured with 0.01 μM melatonin for 24 h followed by 400 μM H2O2 for 2 h, cell viability was measured by a CCK-8 kit (n = 6). (D) The relative mRNA levels of BAX, CASPASE-3, and BCL-2 were detected by qRT-PCR (n = 3). (E,F) The relative protein levels of BAX, CASPASE-3, and BCL-2 were detected by Western blot (n = 3). β-actin was used to normalize the density values of the bands. (G,H) The apoptosis level of granulosa cells was measured by flow cytometry assay (n = 3). Apoptosis rate was expressed as the sum of the values of Q2-2 (late apoptotic cells) and Q2-4 (early apoptotic cells) in the four quadrants. The color from red to blue indicates a decrease in cell density. (I,J) The ratio of TUNEL-positive cells was detected by double staining of TUNEL (green) and DAPI (blue) (n = 3). The values are shown as mean ± SD. Differences between groups were determined by ANOVA. ** p < 0.01, or *** p < 0.001 vs. Control group (0 μmol/L melatonin group). # p < 0.05, ## p < 0.01, or ### p < 0.001 vs. H2O2 group.

