Figure 1.
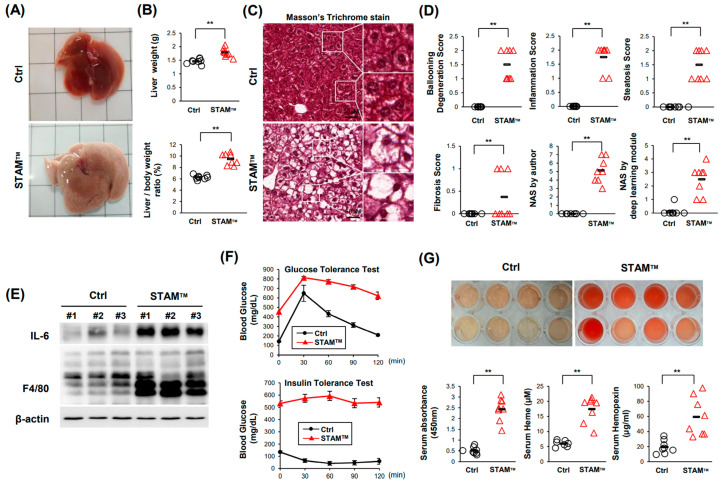
NASH was induced in the STAMTM model. (A) The gross phenotype of the liver. (B) Liver weight (upper) and liver weight/body weight (lower). (C) Masson’s trichrome staining of liver tissue. (D) Scores indicating NAFLD activity. (E) Western blot data showing the expression levels of the inflammatory factors IL-6 and F4/80. (F) Assays showing that insulin resistance was induced in the STAMTM model. GTT (upper) and ITT (lower). (G) Assays showing that hemolysis occurred in the serum of NASH mice. Photograph of serum showing hemolysis, quantification of hemoglobin, heme assay, and hemopexin ELISA. ** p < 0.01, Mann–Whitney U test.

