Figure 4.
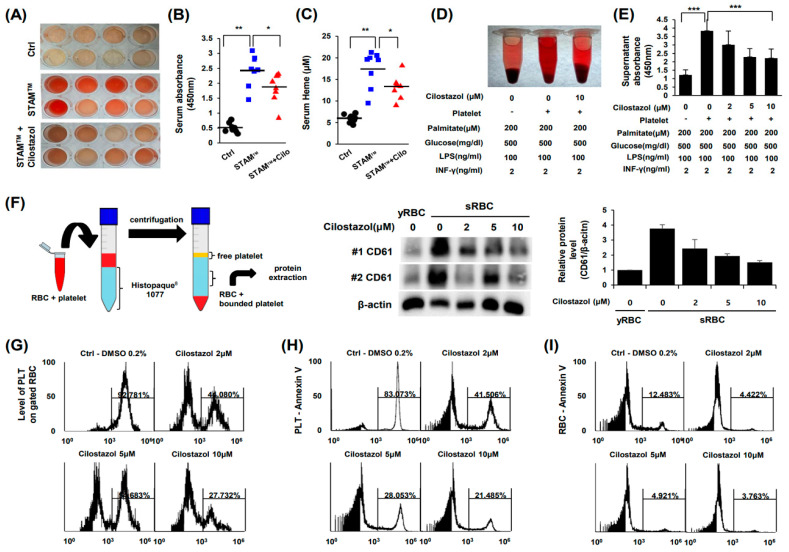
Cilostazol inhibited PLT-RBC contact-induced phosphatidylserine exposure and hemolysis. (A–D) Analysis of serum from STAMTM mice. (A) Photograph of serum. (B) Quantification of hemoglobin. (C) Heme assay. (D,E) In vitro simulation of NASH and RBC-PLT interaction assay. (D) Photograph of suspension. (E) Quantification of hemoglobin. The mean ± S.D. of three independent experiments performed in triplicate is presented. *** p < 0.01 according to Scheffe’s test. (F) Schematic diagram of the experiment (left) and western blotting data (right). (G) RBC-PLT binding. (H,I) Flow cytometry using PKH26-labeled RBCs and PKH67-labeled PLTs. (H) PLT-Annexin-V. (I) RBC-Annexin-V. * p < 0.05 and ** p < 0.01, Mann–Whitney U test. The values in (E) represent the mean ± S.D. of three independent experiments performed in triplicate. *** p < 0.01 according to Scheffe’s test.

