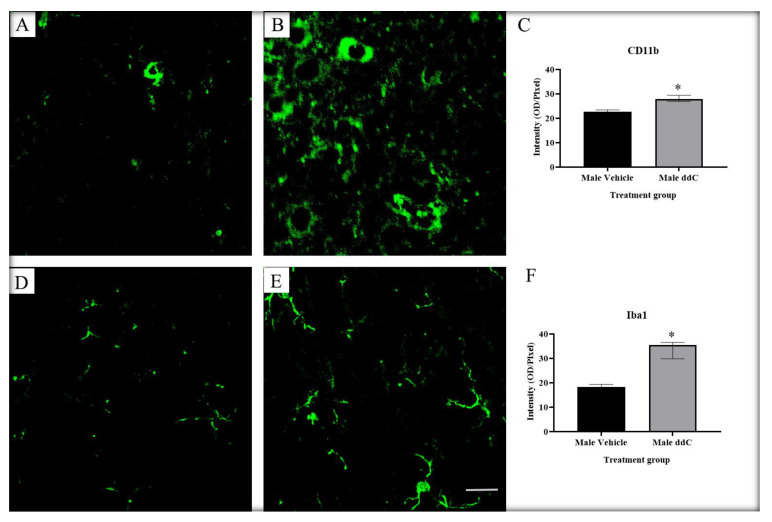
Figure 1.
Immunofluorescent images of microglia from the lumbar sections of the spinal cords immunostained using CD11b and Iba1 on day 7 post-ddC administration of male BALB/c mice. Immunofluorescence staining of CD11b in (A) control vehicle-treated and (B) ddC-treated male mice. (C) Average immunofluorescence staining of CD11b in male mice. Immunofluorescence staining of Iba1 in (D) control vehicle-treated and (E) ddC-treated male mice. (F) Average immunofluorescence staining of Iba1 in male mice. (C,F) Each bar represents the median and interquartile range obtained from four mice. * p < 0.05 compared to control vehicle-treated male mice (Mann–Whitney U test). (A,B,D,E) Scale bar: 20 μm.

