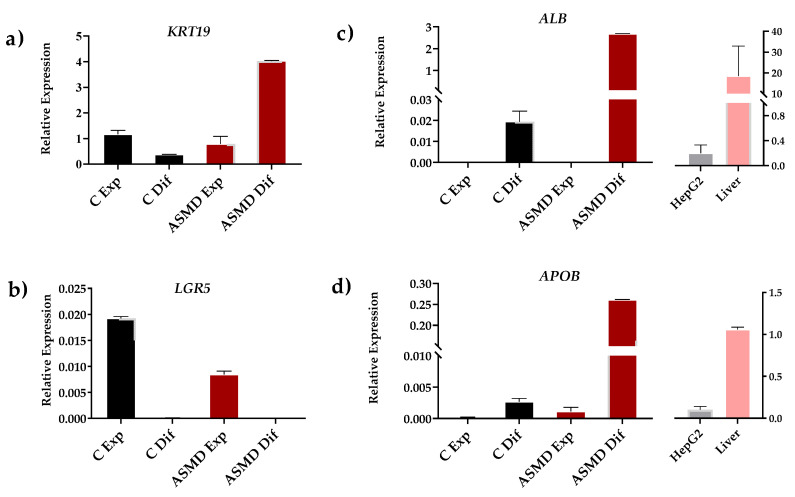
Figure 3.
Gene expression analysis of differentiation markers in control (C) (black) and ASMD type B organoids (red) under expansion (Exp) and differentiation (Dif) conditions. (a,b) Expression of ductal (KRT19) and pluripotent (LGR5) cell markers; (c,d) Expression of differentiated hepatocyte markers (ALB and APOB). These markers were also analyzed in HepG2 cells (gray) and in liver biopsy (pink). Error bar shows standard deviation.

