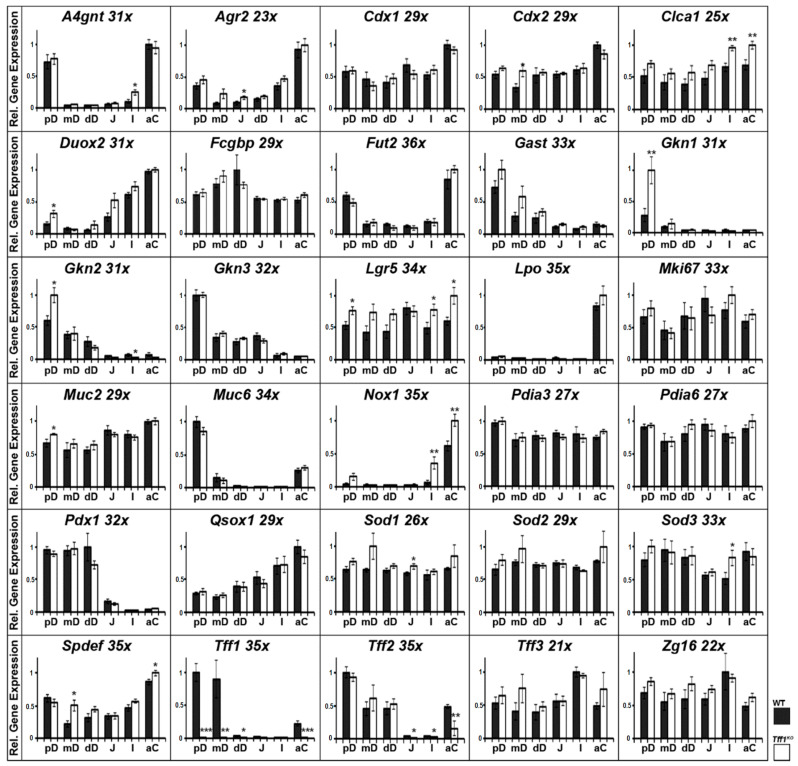
Figure 1.
Semi-quantitative RT-PCR analyses. A4gnt, Agr2, Cdx1, Cdx2, Clca1, Duox2, Fcgbp, Fut2, Gast, Gkn1, Gkn2, Gkn3, Mki67, Lgr5, Lpo, Muc2, Muc6, Nox1, Pdia3, Pdia6, Pdx1, Qsox1, Sod1, Sod2, Sod3, Spdef, Tff1, Tff2, Tff3, and Zg16 expression in different parts of the murine intestine, i.e., proximal, medial, and distal parts of the duodenum (pD, mD, dD), middle section of the jejunum (J), distal ileum (I), and proximal/ascending colon (aC). Extracts of 10 female wild-type (WT, black bars) and 10 female Tff1KO mice (white bars) were investigated. The number of amplification cycles is given after each gene. The relative gene expression levels were normalized against β-actin (Actb, 23x or 24x). Significances are indicated by asterisks (*, p ≤ 0.05; **, p ≤ 0.01; ***, p ≤ 0.001).

