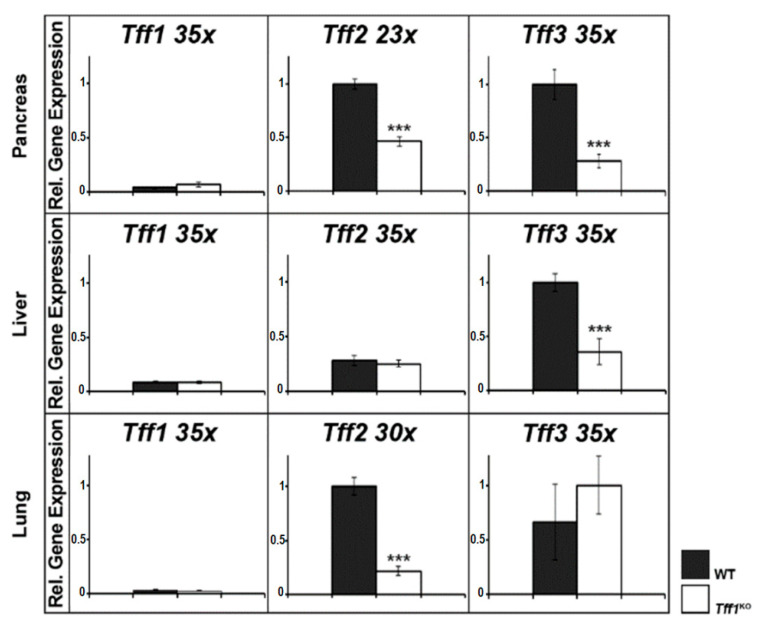
Figure 2.
Semi-quantitative RT-PCR analyses (murine pancreas, liver, and lung). Tff1, Tff2, and Tff3 expression was monitored in extracts of 10 female wild-type (WT, black bars) and 10 female Tff1KO mice (white bars). The number of amplification cycles is given after each gene. The relative gene expression levels were normalized against β-actin (Actb; pancreas 27x, liver 24x, lung 21x). Significances are indicated by asterisks (***, p ≤ 0.001).

