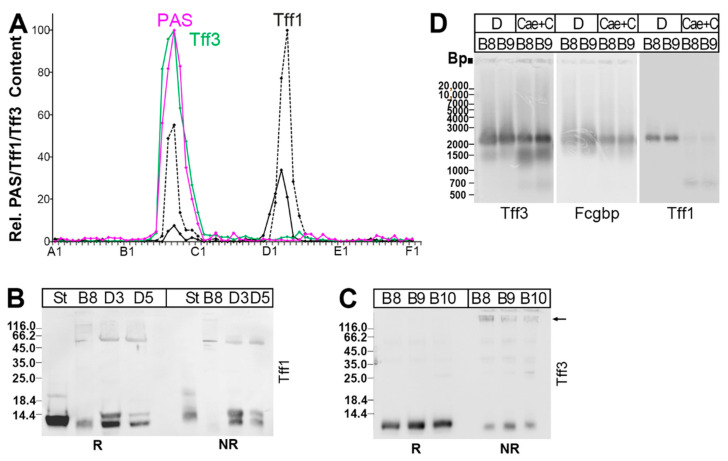
Figure 3.
Analysis of a murine duodenal extract (complete duodena from four animals). The elution profile after SEC on a Superdex 75 HL column as well as the distribution of Tff2 have been reported previously [22]. (A) Distribution of the relative Tff1 (black) and Tff3 contents (green) as determined via Western blot analysis under reducing conditions and semi-quantitative analysis of monomeric band intensities. For Tff1, a regular band (black drawn line) and a somewhat shortened band (black dashed line) were analyzed separately. For comparison, the fractions were analyzed for their mucin content using the PAS reaction (pink); (B) 15% SDS-PAGE under reducing (R) and non-reducing (NR) conditions (post-in-gel reduction), respectively, and Western blot analysis of the high-molecular-mass fraction B8 and the low-molecular-mass fractions D3 and D5 concerning Tff1. As a control, fraction D1 from a murine stomach extract (St; [22]) was analyzed. (C) Analysis of the high-molecular-mass fractions B8–B10 concerning Tff3; (D) 1% AgGE and Western blot analysis of the high-molecular-mass fractions B8 and B9 concerning Tff3, Fcgbp, and Tff1, respectively (D, duodenal extract; Cae+C, extract from caecum plus total colon). Relative standard: DNA ladder (base pairs).

