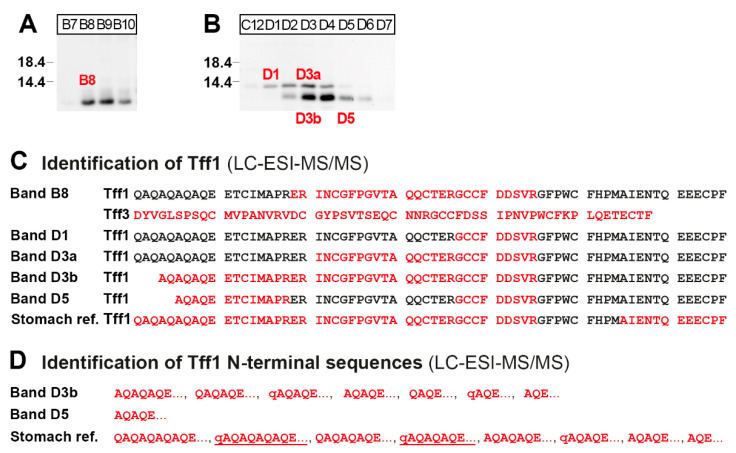
Figure 4.
Proteome analysis of the high- and low-molecular-mass forms of Tff1 in a duodenal extract (fractions B8, and D1, D3, and D5 from Figure 3). (A,B) SDS-PAGE under reducing conditions of the high-molecular mass fractions B7–B10 (A) and the low-molecular-mass fractions C12–D7 (B) and Western blot analysis concerning Tff1. Fractions B8, D1, D3, and D5 were then separated via preparative reducing of SDS-PAGE, and after Coomassie staining, bands termed B8, D1, D3a, D3b, and D5 were excised (marked in red). (C) Results of the proteome analyses after tryptic in-gel digestion of bands B8, D1, D3a, D3b, and D5. Identified regions in Tff1 are shown in red. In B8, Tff3 was also identified. The results of the Tff1 reference (from a stomach extract) are also shown. The longest N-terminal sequences identified are shown. (D) Identification of heterogeneous Tff1 N-terminal sequences in bands D3b and the stomach reference (q indicates a pyro-Glu residue). The predominant sequences are underlined.

