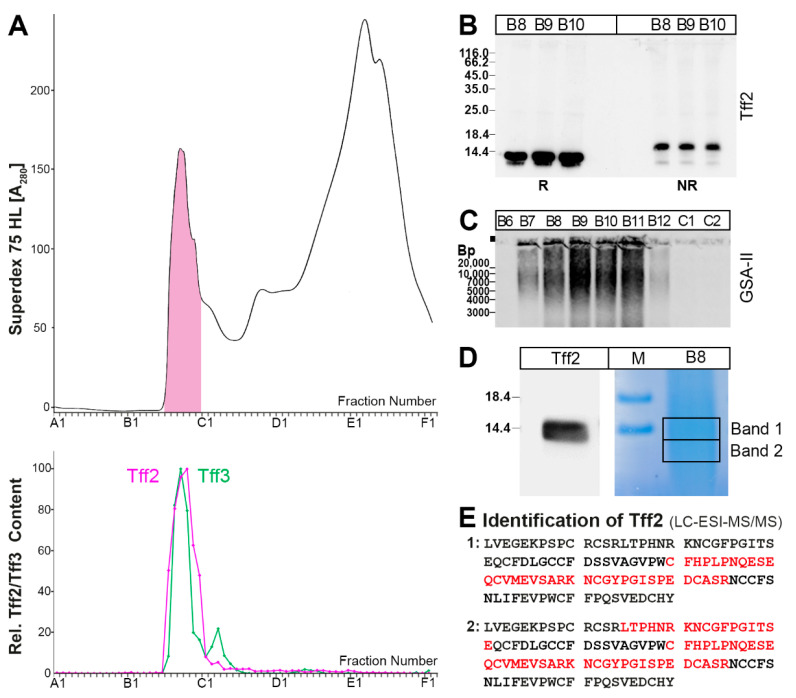
Figure 5.
Analysis of a murine caecum plus total colon extract (single individual). (A) Elution profile after SEC on a Superdex 75 HL column as determined via absorbance at 280 nm (PAS-positive mucin fractions: pink). Underneath: distribution of the relative Tff2 (red) and Tff3 contents (green) as determined via Western blot analysis under reducing conditions and semi-quantitative analysis of the monomeric band intensities; (B) 15% SDS-PAGE under reducing (R) and non-reducing (NR) conditions (post-in-gel reduction), respectively, and Western blot analysis of the high-molecular-mass fractions B8–B10 concerning Tff2; (C) 1% AgGE and Western blot analysis of the fractions B6–C2 concerning Muc6 (lectin GSA-II). Relative standard: DNA ladder (base pairs). (D) SDS-PAGE under reducing conditions of fraction B8. Shown is a Western blot analysis concerning Tff2 and in parallel, Coomassie staining. Bands 1 and 2 were excised for proteome analysis. (E) Results of the proteome analysis after tryptic in-gel digestion of bands 1 and 2. Identified regions in Tff2 are shown in red.

