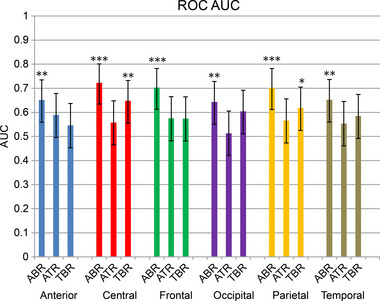
FIGURE 2.

Area under the curve (AUC) of the receiver operating characteristic (ROC) curve for each lobar power ratio. Null hypothesis was set as 0.5 AUC; Delong's method was used to statistically assess whether AUC of each lobar power ratio is bigger than 0.5 AUC. Error bars represent the 95% confidence interval. *p < .05, **p < .01, ***p < .001. ABR, alpha/beta ratio; ATR, alpha/theta ratio; TBR, theta/beta ratio.
