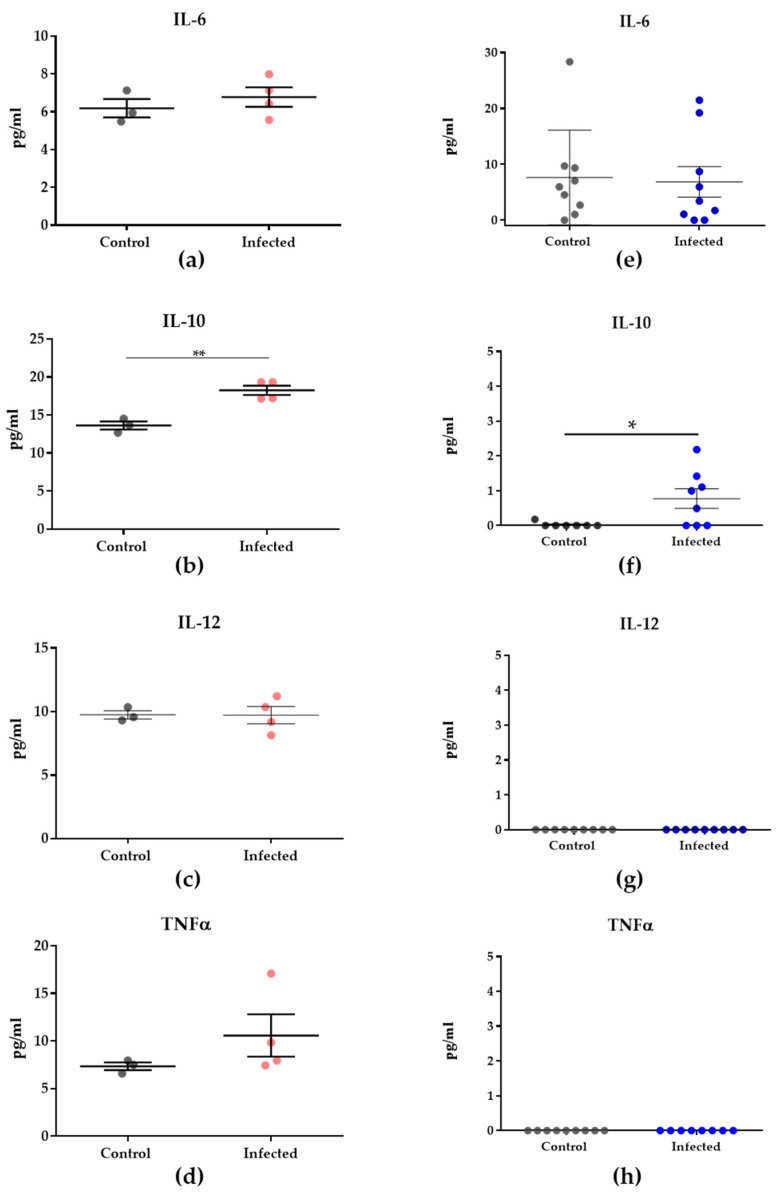
Figure 3.
Cytokine levels of murine and human samples. (a–d) Cytokine levels of murine samples (n = 4 per group; however, control samples presented N/D values for some cytokines). (e–h) Human peripheral plasma (control = 9, infected = 9). All data were submitted to Robust Regression and Outlier Test (ROUT, Q = 0.1%), and Mann–Whitney was performed to evaluate differences between the two groups. Asterisks indicate statistical significance. Legend: Light pink circles represent the murine in-fected samples and dark blue circles correspond to the human infected samples. * p = 0.0424, ** p = 0.0030.

