Figure 1.
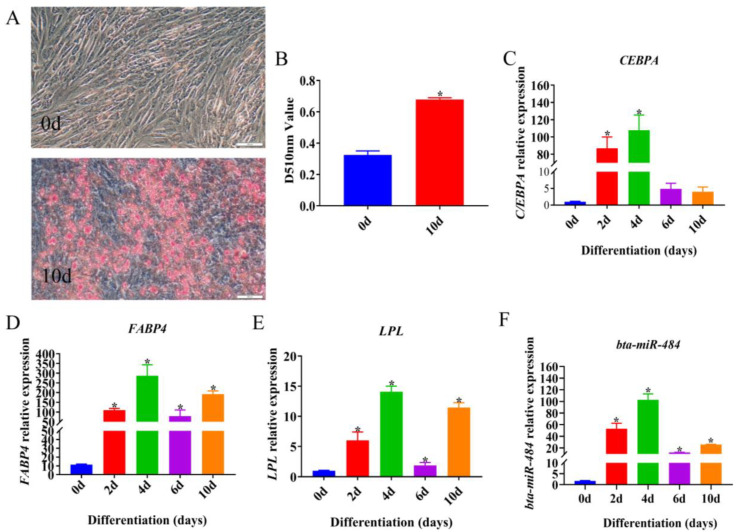
Induced preadipocytes differentiation. (A) Oil Red O staining at 0 d and 10 d after induced preadipocytes differentiation. Scale bar: 200 μm. (B) Oil Red O absorption value detected at 510 nm. (C–F) Expression of CEBPA, FABP4, LPL, and bta-miR-484 during induction of preadipocyte differentiation. Data are presented as mean ± SD. n = 3. * p < 0.05.

