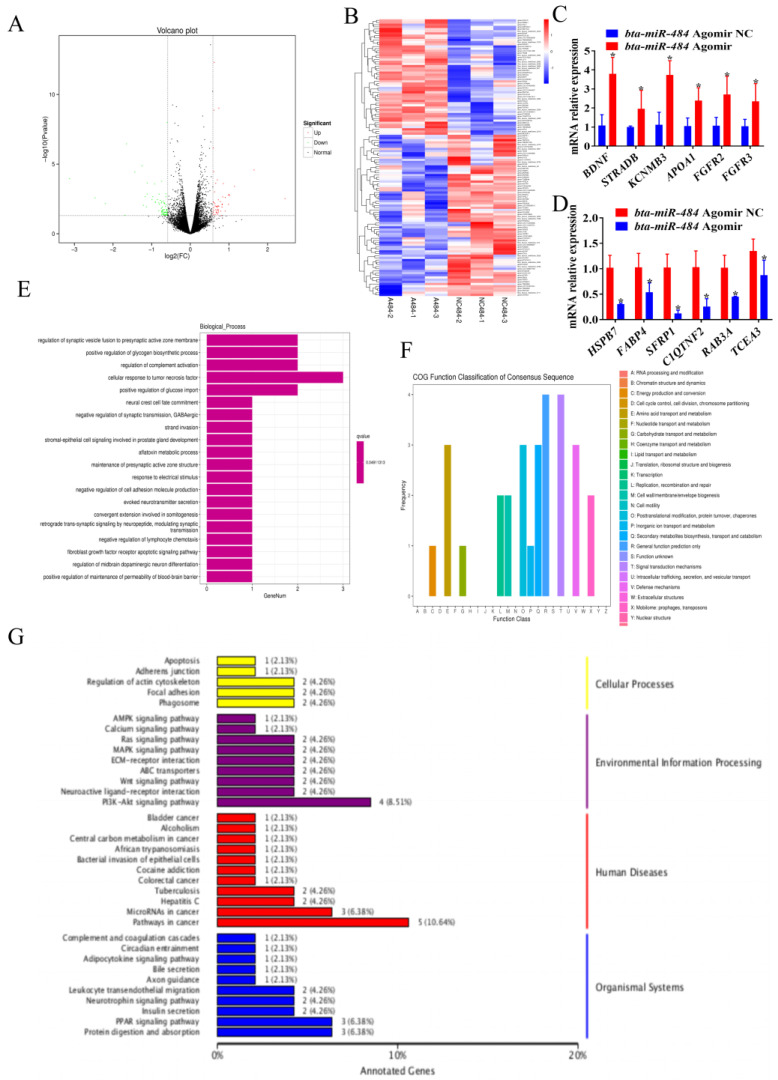
Figure 6.
RNA sequencing analysis of bta-miR-484 overexpression in adipocytes. (A) Differential expression volcano plot. (B) Heat map of differentially expressed mRNAs in control and bta-miR-484 overexpressing adipocytes. A484 = “bta-miR-484 agomir”, NC484 = “bta-miR-484 agomir NC” (C,D) qPCR analysis of DEGs in control and bta-miR-484-overexpressing adipocytes. (E) GO enrichment histogram of differentially expressed genes. (F) COG annotation classification statistics of differentially expressed genes. (G) KEGG classification map of differentially expressed genes. Data are presented as mean ± SD. n = 3. * p < 0.05.

