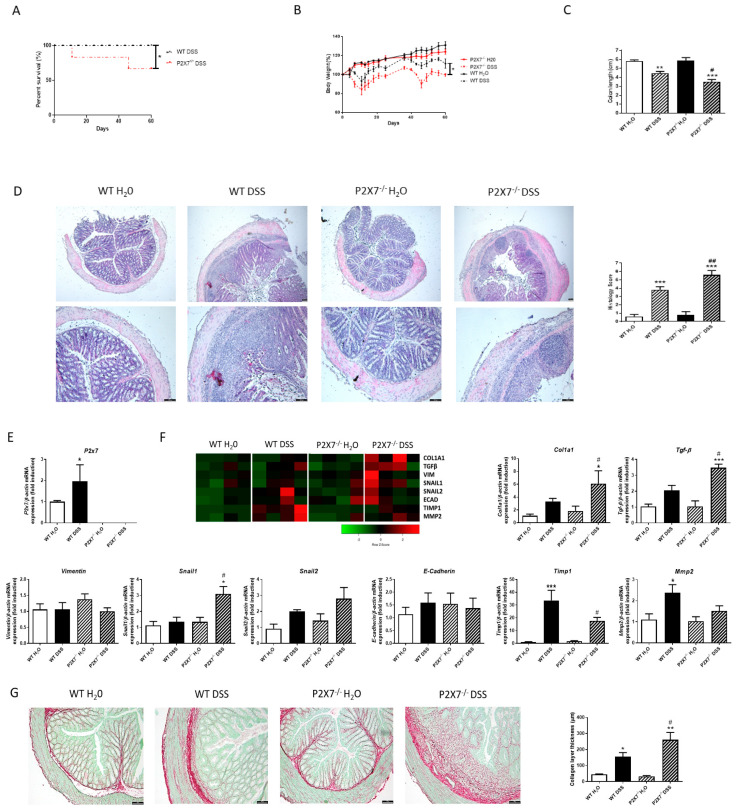
Figure 3.
Lack of P2X7 exacerbates intestinal fibrosis in chronic-DSS colitis model. Chronic murine colitis was induced with four cycles of increasing percentages of DSS (1%, 1%, 1.5%, and 1.5%) in drinking water during 7 days, separated with 10 days for each cycle. (A) Graph shows the survival percentage in both WT and P2X7-/- mice after the four cycles of DSS (n = 5 per group). (B) Graph shows the evolution of body weight in each experimental group (n = 5 per group). (C) Graph shows the colon length of both WT and P2X7-/- mice with and without DSS (n = 5 per group). (D) Representative pictures of each experimental group after hematoxylin–Eosin staining (n = 5 per group). The length of the scale bar represents 100 µm. Graph shows the histological score obtained after the analysis of all the samples of each group. (E) Graph shows mRNA expression of P2X7 receptor (n = 5). (F) Heat map showing the mRNA expression of profibrotic markers Col1a1, TGF-β, Vimentin, Snail1, Snail2, E-Cadherin, Timp1, and Mmp2. Graphs show the mRNA expression of these profibrotic markers in intestinal samples from both WT and P2X7-/- mice with and without DSS (n = 4). (G) Representative images of intestinal samples from the four experimental groups after Sirius Red Staining. The length of the scale bar represents 100 µm. Graph shows the quantification of the thickness of the collagen layer (n = 4). In all cases, bars in graphs represent mean ± SEM. * p < 0.05, ** p < 0.01, and *** p < 0.001 vs. WT H2O; # p < 0.05 and ## p < 0.01 vs. WT–DSS mice.

