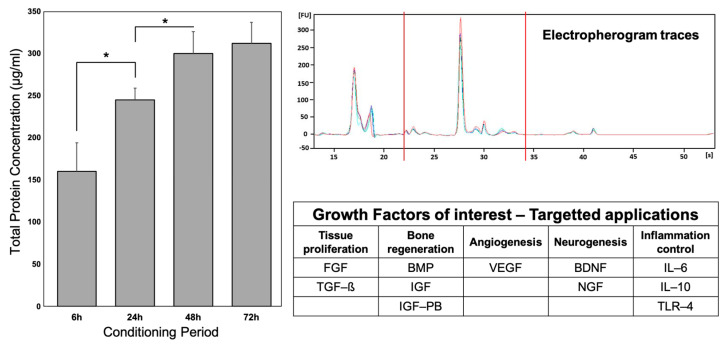
Figure 3.
Control of MSC-CM profile and key protein identification. Left graph represents total protein concentrations with BCA Protein Assay kit, according to conditioning period. * indicates significant difference (p < 0.05) Right graph represents electropherogram traces of MSC-CM, using Agilent Bioanalyzer. The table summarizes key proteins to consider, according to the therapeutic target. Adapted from [48,116].

