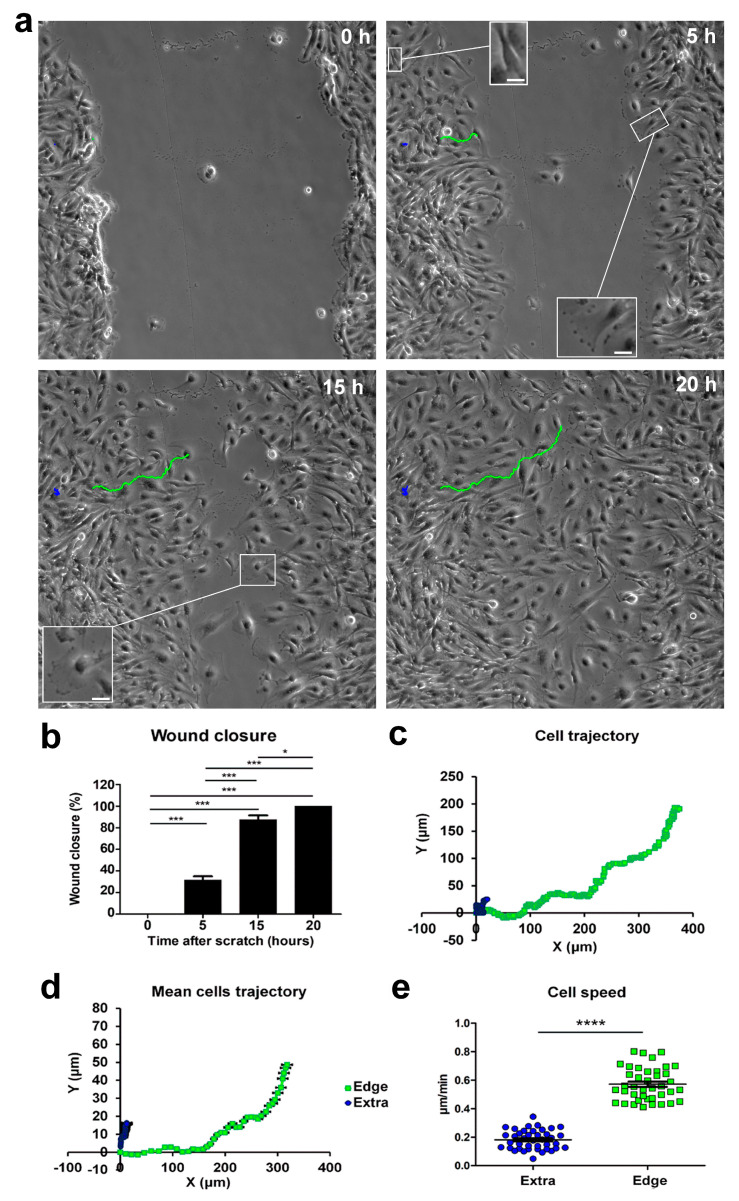
Figure 1.
Time-lapse microscopy of cell migration in the wound-healing assay on U251 GBM cells. (a) Tracking of individual cells located in the extra-scratch (blue) and at the edge of the wounded area (green). Image shots at 0, 5, 15, and 20 h after the wound scratch. Scale bar: 100 µm. Inserts presenting high-magnification images of cells in different positions of the scratch and also showing a lamellipodia as a typical feature of the cells localized at the edge of the scratch. Scale bar: 10 µm (b) Wound closure percentages at 0, 5, 15, and 20 h after the wound scratch. (c) Plotting of the trajectories of one individual cell located outside (extra, blue) and one individual cell at the edge of the scratch (edge, green). Images were analyzed using the Chemotaxis Tool ImageJ software plugin (Version 2.0). (d) Mean trajectories of the cells outside (extra, blue, n = 40 cells) and at the edge of the scratch (edge, green, n = 40 cells). (e) Scatter plot of the velocity (µm/min) of single cells outside (extra, blue, n = 40 cells) and at the edge of the scratch (edge, green, n = 40 cells). p-values: * p < 0.05, *** p < 0.001, and **** p < 0.0001.

